Goal 9
Industry, innovation and infrastructure
In order to measure progress towards target 9.c, the Inter-Agency and Expert Group on Sustainable Development Goal Indicators (IAEG-SDG) has selected the Percentage of the population covered by a mobile network, broken down by technology
(United Nations, 2016a). This indicator reflects a minimum requirement for information and communication technology (ICT) access, showing the population that can potentially subscribe to and use mobile cellular services to communicate.
The future of mobile is incremental innovation with a transformational impactReijo Pold, Telefónica United Kingdom
The Partnership on Measuring ICT for Development has noted that over the past decade, mobile cellular networks have expanded rapidly and helped to overcome the basic infrastructure barriers to fixed telephony (United Nations, 2016b). For many people in developing countries, mobiles are often their only way of accessing the Internet.

For example, in Africa, Internet use is primarily conducted via mobile devices, influencing the scope for and the nature of e-commerce (UNCTAD, 2015a). In least developed countrieThis category was officially established in 1971 by the United Nations General Assembly with a view to attracting special international support for the most vulnerable and disadvantaged members of the United Nations family. Their low level of socioeconomic development is characterized by weak human and institutional capacities, low and unequally distributed income and scarcity of domestic financial resources.
more (LDCs) mobile phones have allowed the poorest to become connected, and that increasingly mobiles are tools for entrepreneurship, empowerment, and even financial inclusion. Nevertheless, as figure 9.19 illustrates, despite the rapid improvements in coverage, LDCs still lag someway behind other development groupings.
In the context of international trade and development, access to broadband Internet, through third generation (3G) and fourth generation (4G) systems, in particular, are important because it allows access to more sophisticated and value-added content for the business sector.
In 2015, ITU estimated that 69 per cent of the global population was covered by 3G mobile broadband, up from 45 per cent in 20119.25.
Africa has had the highest regional growth rate over the past three years, with mobile-broadband penetration increasing from an estimated 2 per cent in 2010 to over 17 per cent in 2015. Nevertheless, it remains the region with the lowest mobile broadband penetration.
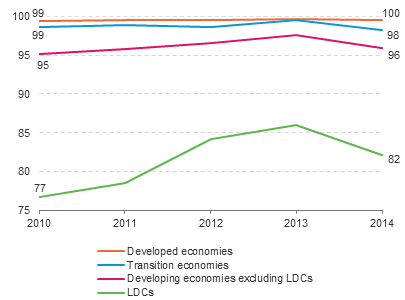
In a similar pattern to that shown in figure above, figure 9.20 shows a dramatic improvement in 3G coverage for LDCs in recent years but also illustrates the considerable gap that remains between LDCs and other development categories.

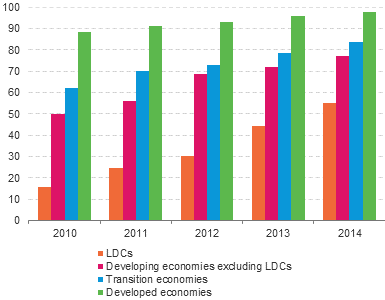
Given the important enabling role of broadband in the digital economy, the Number of businesses using the Internet by type of access
provides a good indicator of the productive sector leveraging Internet to create opportunities and foster innovation. The adoption of Internet by microenterprises and SMEsNon-subsidiary independent firms that employ fewer than a given number of employees. This number varies across countries.
more is also a tool for inclusive and sustainable industrialization
and an important factor in engaging in both online and offline international trade in goods and services. However, the ability of developing countries to assess the extent to which businesses use Internet and to monitor progress towards their ICT development policies is curtailed by the lack of official statistics. Unfortunately, there is very little data on the use of either fixed or mobile broadband by enterprises in developing countries, and almost none from LDCs9.26.
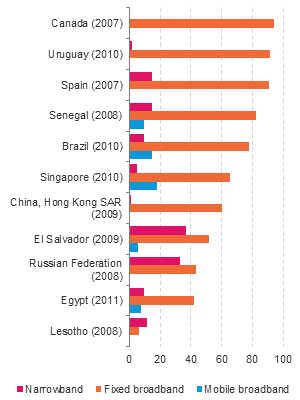
The available data show that within countries there is a persistent gap in Internet use between small and large enterprises, and between countries there is a divide in Internet use through broadband connections. Since Internet use by employees has been positively correlated with productivity (World Bank, 2016c), then smaller enterprises in developing countries will struggle to improve the relative effectiveness of their productive effort. Internet use is also a determinant of e-commerce, and data from enterprises in European countries show a positive correlation between online sales and labour productivity, with a larger impact on service industries and smaller enterprises (UNCTAD, 2015c). E-business has also been shown to contribute to poverty reduction, innovation and financial inclusion, and to integrating value chains and enabling exports (World Summit on the Information Society (WSIS), 2015). Figure 9.21 shows business use of Internet (narrowbandConnections with a download speed of less than 256 Kbit/s, in one or both directions
more, fixed broadband Connections with a download speed equal to or greater than 256 Kbit/s, in one or both directions, using technologies such as Digital Subscriber Line, cable modem, high-speed leased lines, fibre-to-the-home, powerline, satellite, fixed wireless, Wireless Local Area Network and WiMAX.
more, and mobile broadbandConnections with a download speed equal to or greater than 256 Kbit/s, in one or both directions, using technologies such as Universal Mobile Telecommunications System, high-speed Downlink Packet Access and Uplink Packet Access
more) in selected developed, developing, and transition economies.
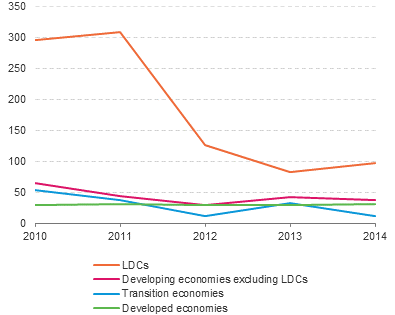
Despite increased connectivity, Internet access (in particular broadband) remains unaffordable for many people in LDCs (ITU, 2015b). Consequently, an additional indicator on targeting broadband Internet prices, including mobile broadband, would be useful for assessing the affordable access
element of target 9.c. Reducing prices should also contribute to significantly increase access
to ICT. The Broadband Commission for Digital Development set a broadband affordability target of a cost of 5 per cent of monthly per-capita gross national incomeGross National Income is Gross Domestic Product (GDP) less net taxes on production and imports, less compensation of employees and property income payable to the rest of the world, plus the corresponding items receivable from the rest of the world (in other words, GDP less primary incomes payable to non-resident units, plus primary incomes receivable from non-resident units).
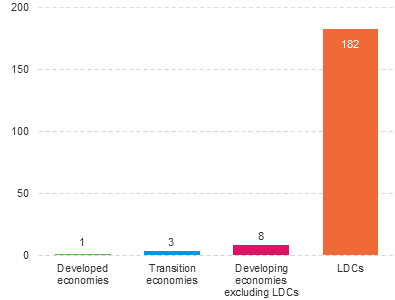
more for basic fixed-broadband services (Broadband Commission for Sustainable Development, 2015). This target was achieved in 105 out of 181 countries (58 per cent) for which data were available by 2014 (ITU, 2015b). Of the remaining 76 economies, 54 per cent were LDCs. Despite the improvement in broadband affordability and the fact that mobile broadband is becoming cheaper than fixed broadband, there is still a large gap between countries.
Figures 9.22 and 9.23 show that fixed-broadband prices can be three times higher in developing countries compared with developed countries, and mobile broadband can be twice as expensive.