


Goal 9
Industry, innovation and infrastructure
Economic development involves a process of structural transformation towards more diversified and higher-value-added activities. The proportion of medium- and high-technology (MHT) industry9.24 value added to total value added gives an indication of the utilization of production technology in the manufacturing sector of an economy. Hence the relevance of the indicator Proportion of medium and high-tech industry value added in total value added
selected by IAEG-SDG.
Modern manufacturing is essential for economic development. Although MHT manufacturing tends not to generate as much employment as low-skilled, labour-intensive manufacturing, modern manufacturing nevertheless generates well-paid employment (including through manufacturing-related services) and income; plays a critical role in increasing labour productivity; and creates spill-over effects for other economic sectors through embodied and disembodied technical changeEmbodied technical change refers to improvements in the design or quality of new capital goods or intermediate inputs. Disembodied technical change is the shift in the production function (production frontier) over time.
more.
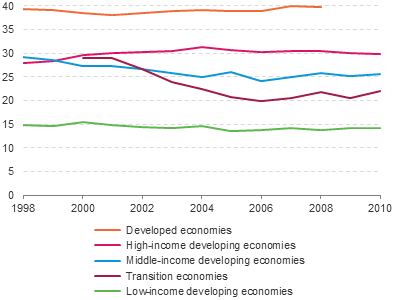
More advanced economies tend to show higher shares of MHT industry value added in total MVA (see figure 9.18 and table 9.5).
The different human capital and natural resource endowments available to a country have an important influence on their economic structure. For instance, in 2008 the level of MHT industry value added in total MVA was relatively low in several developed economies: Luxembourg (5 per cent), New Zealand (14 per cent) and Australia (16 per cent).

For several high-income developing economies, like Iran (41 per cent), Malaysia (42 per cent) and Singapore (75 per cent) the importance of MHT industry value added was considerable. The same is true for some middle-income countries (for example, Indonesia - 38 per cent).
Country data reveal that increasing the economic weight of MHT industries in MVAManufacturing value added (MVA) is the total value of goods and services net of intermediate consumption. It is generally compiled as the sum of the value added of all manufacturing activity units in operation in the reference period.
more is a slow and uncertain process. Only a handful of economies (Hungary, Oman, Poland, Slovakia and Switzerland) have increased the weight of MHT value added in total MVA by more than 10 percentage points in a 10-year period (table 9.5). Meanwhile, a number of countries have seen this weight reduced by more than 5 percentage points (Australia, Azerbaijan, Canada, Greece, India, Ireland, Luxembourg, Malaysia, Mexico, Nepal, the Russian Federation and Senegal).