

Goal 2
Zero hunger

The Agriculture Orientation Index (AOI)The AOI for government expenditures as defined by FAO is the agriculture share of government expenditures divided by the agriculture share of gross domestic product (GDP).
more for government expenditures has been selected by IAEG-SDG as the appropriate indicator for this target (United Nations, 2016). The AOI, compiled by FAO, is the ratio of the share of government expenditures on agriculture over the contribution of agriculture to the economy. It shows the extent to which government expenditures on agriculture reflect (or not) the importance of agriculture in the overall economy. While coverage is high (150 countries), some countries have not yet provided data. FAO also cautions that the level or definition of government to which expenditures pertain can differ, affecting comparability. An AOI with a value greater than 1 indicates that a government has given more prominence to agriculture relative to its contribution to the economy (as measured by gross domestic product (GDP)). An AOI of less than 1 indicates that governments of these countries give greater prominence to non-agricultural sectors. The index gives another perspective on government investment in this sector of the economy compared with the individual measures of the share of agriculture in government expenditures or the contribution of the agricultural segment to the overall economy.
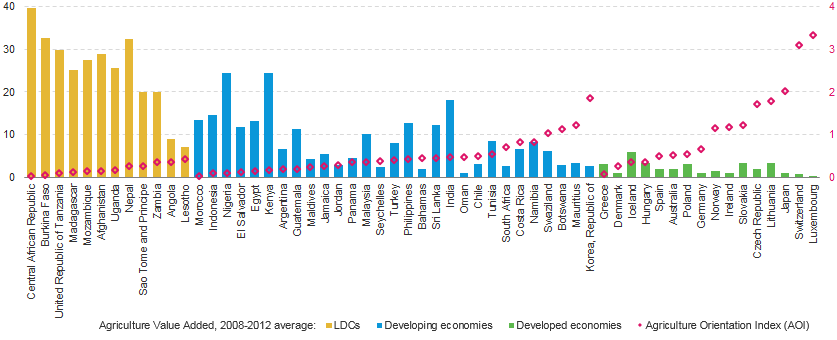
Figure 2.6 illustrates that, in general, while the contribution of agriculture to economies in developing countries, in particular least developed countries (LDCs)The category of Least Developed Countries (LDCs) was officially established in 1971 by the UN General Assembly with a view to attracting special international support for the most vulnerable and disadvantaged members of the UN family.
more, is higher compared to that in the developed world, their AOI is lower. In Europe, for example, countries such as Luxembourg and Switzerland invest three times more in agriculture compared to its contribution to GDP. At the other extreme, for some LDCs and developing countries, such as Burkina Faso, the Central African Republic and Morocco the agricultural sectors received less than one tenth as much in public expenditures as their contribution to the countries’ respective GDPs. The figure, which also provides each country’s agricultural sector value added, shows an inverse relationship between the agriculture value added and the orientation of government expenditures, with a Pearson correlationThe Pearson correlation (or Pearson product moment correlation) is the most common measure of correlation used in statistics.
more coefficient of −0.42.
Furthermore, FAO data (figure 2.7) show that governments in developing countries, LDCs and in particular landlocked developing countries devote a much higher share of total expenditure on agriculture in comparison to governments in developed countries and also small island developing states.
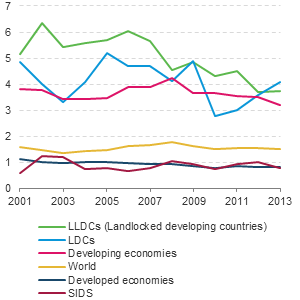
Over the past decade, government expenditure invested in agriculture in developing countries has been relatively stable (at around 3 or 4 per cent of total expenditures), but with growing emphasis being placed on industrialization and privatization there is often pressure to reduce investment in the agricultural sector. What the optimum level of investment is will depend on many factors, but there are clearly risks for environmental sustainability and food security, and also for agricultural research and public infrastructure if government expenditure on agriculture is reduced too far (Mogues et al., 2012).
Using an approach presented by FAO in 2001, figure 2.8 examines the correlation between the AOI and the prevalence of undernourishment in developing countries employing updated data averaged for the years 2010, 2011 and 2012.
The analysis suggests there is no clear correlation between the two.
For example, there are many countries with undernourishment prevalence rates of around 5 per cent but with a wide range of AOI values, ranging from countries such as Argentina and Egypt, both with AOI values of 0.1, to the Republic of Korea with an AOI of 1.9. Nevertheless, as already noted, many developing countries have an AOI value of less than 1, signifying that governments place greater prominence on non-agricultural sectors.

The AOI may be important in the context of future population projections (see special note on population).
If the median population projections are broadly correct and the global population in 2050 rises to approximately 9.7 billion, then FAO estimates that this will require a 60 per cent increase in global food production (FAO, 2011)2.14. It should be noted that when FAO calculated this estimate, the median population projection for 2050 was only 9.2 billion. With the upward revision to the population projections, it is possible, that a 60% increase in global food production may now be an underestimate.