Goal 12
Responsible consumption and production
IAEG-SDG selected the Amount of support to developing countries on research and development for sustainable consumption and production and environmentally sound technologies
as the best measure for target 12.a. However, at the time of writing, no data or metadata are available (United Nations Statistics Division, 2016).
Research is to see what everyone else has seen, and to think what nobody else has thought. Albert Szent-Gyorgyi
 While there are no comparable data available on research and development support given to developing countries, a measure of activity can be derived from the number of patents and intellectual property held by these countries. This, of course, is not the same thing, but in the absence of specific data it at least provides some information on trends for developing countries.
The most commonly used indicators to monitor resources devoted to research and development worldwide are total gross domestic expenditure on research and development (GERD)12.12; research and development intensity12.13; and global share12.14.
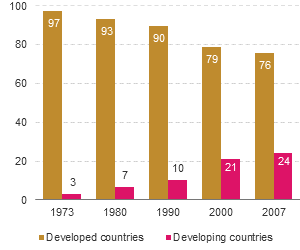
Figure 12.3 illustrates total GERD and the steady growth in the share of research and development expenditure by developing countries since the 1970s. In 2007, these countries accounted for almost a quarter of global research and development expenditure; however, these global aggregates hide considerable differences between the countries due to the fact that research and development has been highly concentrated within a limited number of them. Data were not available for many countries prior to 2000, but for some, such as Japan, GERD expenditure increased from 8 per cent of the estimated global in 1973 to 13 per cent in 2007. China, too, dramatically increased its share, from 3 per cent in 1990 to 19 per cent in 2007. Less dramatic but nonetheless noteworthy, the Republic of Korea increased its share from less than 2 per cent in 1990 to 3.7 per cent in 2007. The Asian region as a whole accounted for almost 80 per cent of the total increase in the developing countries’ share between 1973 and 2007 (Arond and Bell, 2010).
Since 2007, the main changes have been between North America/Western Europe and the East Asia-Pacific region - the former has seen a significant decline in world share (from almost 57 per cent in 2007 to 48 per cent in 2013) and the latter has enjoyed a commensurate increase, from almost 31 per cent to 38 per cent over the same period (United Nations Educational, Scientific and Cultural Organization (UNESCO), 2015). The source of research and development spending also varies considerably by region, country and economy/territory. In Belgium, China, Denmark, France, Germany, Chinae Hong Kong SAR, Iceland, Ireland, Japan, Malaysia, the Philippines, Puerto Rico, the Republic of Korea, Singapore, Slovenia, Sri Lanka, Sweden, Switzerland, Thailand and the United States of America at least 50 per cent of research and development expenditure is accounted for by business enterprise. In many of these countries, the contribution is substantially higher than in others, particularly in Asia. In Africa, South and Western Asia, Central America and Eastern Europe, government expenditure accounts for the largest share.
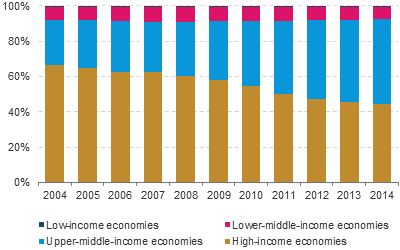
What is the outcome of these changes in research and development expenditure? There are various ways in which this question could be answered. One very simple approach to assessing the impact of research and development expenditure is to examine the total number of intellectual property12.15 applications (including patentsAn exclusive right granted for an invention.
more, copyrightCopyright is a legal term used to describe the rights that creators have over their literary and artistic works. Works covered by copyright range from books, music, paintings, sculpture and films, to computer programs, databases, advertisements, maps and technical drawings.
more, trademarksA sign capable of distinguishing the goods or services of one enterprise from those of other enterprises.
more, industrial designsAn industrial design constitutes the ornamental or aesthetic aspect of an article.
more and geographical indicationsGeographical indications and appellations of origin are signs used on goods that have a specific geographical origin and possess qualities, a reputation or characteristics that are essentially attributable to that place of origin.
more) - see figure 12.4. Over the past decade the number of new global applications almost doubled from around 6,900 in 2004 to just over 12,200 in 2014. During this time, there has been a noticeable shift in applications between high-income and upper-middle-income countries, so that in 2014 upper-middle-income countries accounted for the largest share of new applications (48 per cent). There has been no change in applications in lower-middle or low-income countries.
From a regional perspective, this translates into a significant increase in new applications from Asia, accounting for over 58 per cent of all applications in 2014. A very significant decline in applications is noted from Europe, down from 36 per cent in 2004 to 22 per cent a decade later. There was also a decline in applications from the United States. There was no change from Oceania, but declines from both Africa and Latin America, suggesting there has been no significant improvement in what has been described as the third-world R&D desert
(Annerstedt, 1988).