Goal 10
Reduced inequalities
Today, the principles of development finance identified and agreed by the first Conference on Financing for Development - the 2002 Monterrey Consensus (United Nations, 2003) - still remain the basis for international development finance cooperation. Increasing international financial assistance and technical cooperation for development
and mobilizing international resources for development: foreign direct investment (FDI) and other private flows
are two of the six pillars of the Monterrey Consensus. In 2015, at the third Conference on Financing for Development in Addis Ababa, United Nations Member States agreed on a series of new initiatives and concrete measures to overhaul global finance practices and generate investments for tackling a range of economic, social and environmental challenges
.
When you don’t invest in infrastructure, you are going to pay sooner or later. Mike Parker (2005)

On ODAThe flows to countries and territories on the DAC list of Official Development Assistance recipients and to multilateral institutions.
more, developed countries recommitted to achieving the target of 0.7 per cent of gross national income within the time frame of Agenda 2030. The action agenda of the Conference also recognized the importance of focusing the most concessional resources on those with the greatest needs and least ability to mobilize other resources
, and urged countries to achieve the target of 0.15 to 0.25 per cent of ODA for LDCs and to reverse the decline in the share of ODA to LDCs.
On mobilizing international resources for development, the Addis Ababa Action Agenda reaffirms that international private capital flows, particularly FDI, along with a stable international financial system, are vital complements to national development efforts
in financing sustained economic growth.
FDI, however, is concentrated in certain sectors in many countries, and often bypasses countries most in need
. FDI will not automatically generate technology transfer or linkages with domestic enterprises, nor will it automatically guarantee diversification into more dynamic activities10.27. United Nations Member States agreed to adopt and implement investment promotion regimes, including financial and technical support, for the poorest and most vulnerable countries.
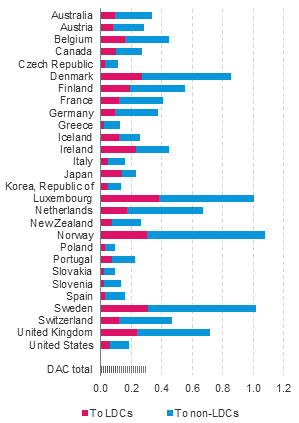
In 2014, total development aid10.28 reached US$161 billion, a 6.8 per cent increase on the previous year and the second consecutive yearly increase after a fall in 2012. Several DAC members reduced their ODA in 2011 or 2012 due to budgetary pressure following the financial crisis. In 2014, DAC members’ total ODA rose by 1.8 per cent, to US$137 billion; 16 countries increased their ODA amounts compared to the previous year. In 2014, five of the 28 DAC member countries met the target of 0.7 per cent of gross national income of ODA (Denmark, Luxembourg, Norway, Sweden and the United Kingdom of Great Britain and Northern Ireland) (see figure 10.7). See also Goal 17 targets 17.2 and 17.9.
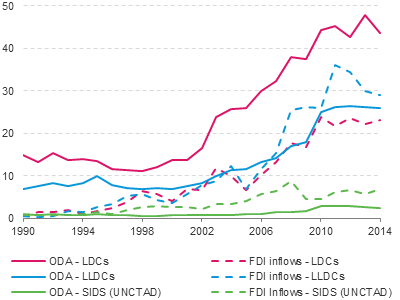
ODA flows to LDCs have more than doubled since the 2002 Monterrey Consensus. Net FDI inflows to LDCs more than tripled, while inward FDI stock more than quadrupled between 2002 and 2014. In 2014, LDCs received net ODA worth US$44 billion from DAC countries, the equivalent of 30 per cent of total ODA.
FDI inflows from the world to LDCs during the same period were US$23 billion, a 4 per cent increase from the previous year. But while FDI flows to LDCs were the equivalent of half the value of ODA, FDI stock increased by 10 per cent, reaching US$222 billion (valued in current prices) in 2014. FDI inflows to LDCs are concentrated in a small number of mineral-rich economies, and in 2014, five countries (the Democratic Republic of the Congo, Equatorial Guinea, Mozambique, the United Republic of Tanzania and Zambia) accounted for 58 per cent of total FDI inflows to LDCs.
UNCTAD predicts that, based on announced FDI greenfield projects10.29 in 2014, this skewed distribution will remain, at least, for some time (UNCTAD, 2015b; UNCTADstat) (see figure 10.8).
SIDScovers the 29 countries included in the UNCTAD’s informal list of SIDS. The official list of SIDS according to UN-OHRLLS is longer and includes also the following countries: Bahrain, Belize, Cuba, Dominican Republic, Guinea-Bissau, Guyana, Haiti, Singapore and Suriname.
The Addis Ababa Action Agenda recognizes the special needs of LLDCs in structurally transforming their economies, harnessing benefits from international trade, and developing efficient transport and transit systems
(United Nations, 2015b). FDI inflows to LLDCs exceeded those of ODA in 2007. Net ODA receipts to LLDCs fell by 1 per cent in 2014 but net FDI inflows fell by 2.8 per cent to US$29.1 billion. FDI inflows to LLDCs are concentrated in several economies and in 2014 the top five10.30 economies accounted for 71 per cent of total flows. Azerbaijan, Kazakhstan and Turkmenistan have received 50 to 60 per cent of the total inflows to LLDCs since 2010 (59 per cent in 2014). FDI inflows to Ethiopia and Zambia rose from US$922 million in 2010 to US$3.7 billion in 2014, increasing these countries’ share of LLDC FDI inflows from 4 to 13 per cent.
SIDSSIDS were recognized as a distinct group of developing countries facing specific social, economic and environmental vulnerabilities at the Earth Summit.
more require special attention due to their particular vulnerabilities, which may constrain their achievements with regard to Agenda 2030 (United Nations, 2015c). Characterized by insularity, geographic remoteness, smallness of economies, populations and areas, SIDS have narrow resource bases and limited options for economic diversification. They are heavily dependent on volatile export markets and cannot achieve economies of scale. Climate change and rising sea levels pose significant threats to their survival. Although SIDS recognize their ownership and leadership in overcoming these challenges, their success in implementing the Sustainable Development Goals will hinge on the availability of international cooperation and the full participation of relevant stakeholders, including people, governments, civil society and the private sector.
FDI remains the main source of external financing for SIDS. Total FDI inflows to the 29 SIDS was almost US$7 billion in 2014 and the stock of inward FDI was valued at US$98 billion in 2013 - high Levels relative to the size of their economies. The ratio of FDI inflows to gross fixed capital formation (GFCF) for SIDS is much higher (27 per cent in 2014) than that of developing countries in general (almost 8 per cent) and the world (almost 9 per cent in 2013). The ratio of FDI stock (US$98 billion) to GDP (91 per cent of GDP in 2013) also reveals the significance of FDI for SIDS.

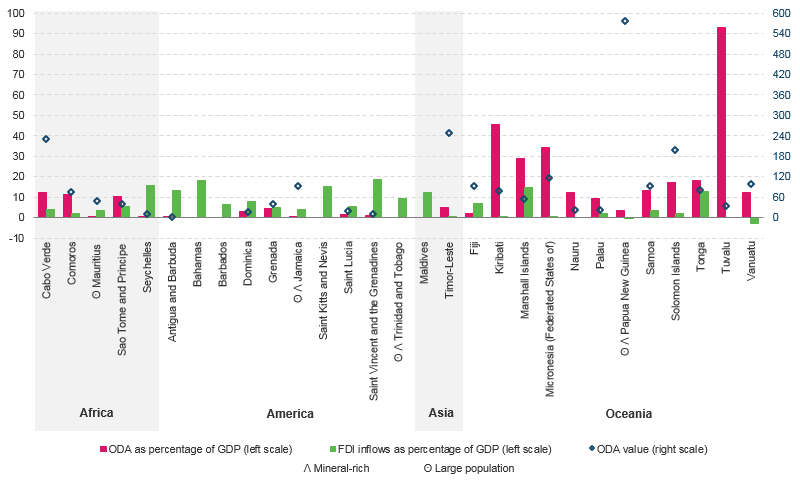
The patterns of ODA and FDI flows are quite different between SIDS (see figure 10.9). FDI inflows and stock are concentrated in a small number of countries10.31. FDI inflows in 2014 to Bahamas (US$1.6 billion), Jamaica (US$0.6 billion), and Trinidad and Tobago (US$2.3 billion) accounted for two thirds of FDI inflows to SIDS. The share of FDI stock of these three countries was 60 per cent. Regionally, FDI into SIDS is concentrated mostly in the Caribbean and in countries with rich mineral deposits, good tourism opportunities, or those offering fiscal advantages. Australia and the United States are the main direct investors in SIDS, although China is emerging as a new investor (UNCTAD, 2015b). ODA to SIDS was US$2.4 billion in 2014, a 14 per cent fall on the previous year, the third consecutive year of decline. In contrast, the main SIDS recipients of ODA are Cabo Verde, Papua New Guinea, the Solomon Islands and Timor-Leste. These four countries receive about 50 per cent of ODA directed to SIDS. The ODA received by Kiribati, the Marshall Islands, the Federal States of Micronesia and Tuvalu was equivalent to more than one third of their combined GDP. Seven additional countries10.32 received ODA corresponding to more than 10 per cent of their GDP.