Goal 4
Quality education
Education is critical to self-reliance and self-determination. As the old adage says Give a man a fish and feed him for a day. Teach a man to fish and feed him for a lifetime
. But education is more than simply the key to overcoming hunger; it is the key to overcoming baseless superstition and illogical argument. Thus, education is essential for good decision-making, accountability and understanding. It is the seed from which ethics, cooperation, growth and health all grow. It is for this reason that Nelson Mandela said Education is the most powerful weapon which you can use to change the world
(Nelson Mandela, 2003).

The Millennium Development Goals set out to ensure that, by 2015, children everywhere, boys and girls alike, would be able to complete a full course of primary education (Goal 2, target 2.a). While this wasn’t fully achieved, very significant progress was reported. Enrolment in primary education in developing regions reached 91 per cent by 2015, up from 83 per cent in 2000. Furthermore, literacy rates among those aged between 15 and 24 improved globally from 83 per cent to 91 per cent between 1990 and 2015. Gaps in literacy between women and men also narrowed. Nevertheless, in developing regions, children from the poorest households are four times more likely to miss school compared with those from wealthier households. Moreover, in countries affected by conflict, the proportion of children out of school increased from 30 per cent in 1999 to 36 per cent in 2012. Today, some 57 million children of primary school age are still missing school (Goal 2, target 2.a).
The 2030 Agenda takes a broader view of education than that encompassed in the Millennium Development Goals and includes not just primary education but life-long learning. This wider focus is illustrated by the variety of actions targeted, for example: ensure all boys and girls have access to pre-primary care and education, complete free and quality primary and secondary educationSecondary education provides learning and educational activities building on primary education and preparing students for both first labour-market entry as well as post-secondary non-tertiary and tertiary education.
more and have access to affordable technical, vocational and tertiary educationTertiary education builds on secondary education, providing learning activities in specialized areas. It aims at learning at a high level of complexity and specialization.
more. While Goal 4 stresses the importance of improving skills (including, but not limited to, literacy and numeracy) necessary for economic development, it also places emphasis on gender and social elements, such as the elimination of gender, minority and disabled disparities in the level of education available. To achieve this, it is recognized that more qualified teachers, better facilities and more scholarships must be made available.
The United Nations Educational, Scientific and Cultural Organization (UNESCO) has developed a composite Education for All
Development Index (EDI) to try to capture the complexity and cross-cutting nature of education and thus allow an evaluation of progress towards education for all (EFA). The index is comprised of four elements: universal primary educationPrimary education provides learning and educational activities typically designed to provide students with fundamental skills in reading, writing and mathematics (that is, literacy and numeracy), and to establish a sound foundation for learning and solid understanding of core areas of knowledge and personal development, preparing for lower secondary education.
more, adult literacy, quality of education and gender4.1. UNESCO provides a note of caution for users, both owing to the lack of data availability (the latest index available – 2011 – could only be compiled for 115 countries) but also as a composite index must necessarily include a range of complex and multifaceted issues caution must be used with the interpretation4.2. Nevertheless, the index provides a useful, simple summary of education around the world today and, despite only covering 55 per cent of countries, the index appears to provide reasonably good coverage of countries classified by income level. EDI index values can fall between 0 and 1, where 1 represents full achievement of EFA across the four elements or subindices, and zero represents absolutely no progress. Countries are categorized into four classifications: (1) far from EFA
4.3; (2) intermediate position
4.4; (3) close to EFA
4.5; and (4) EFA achieved
4.6.
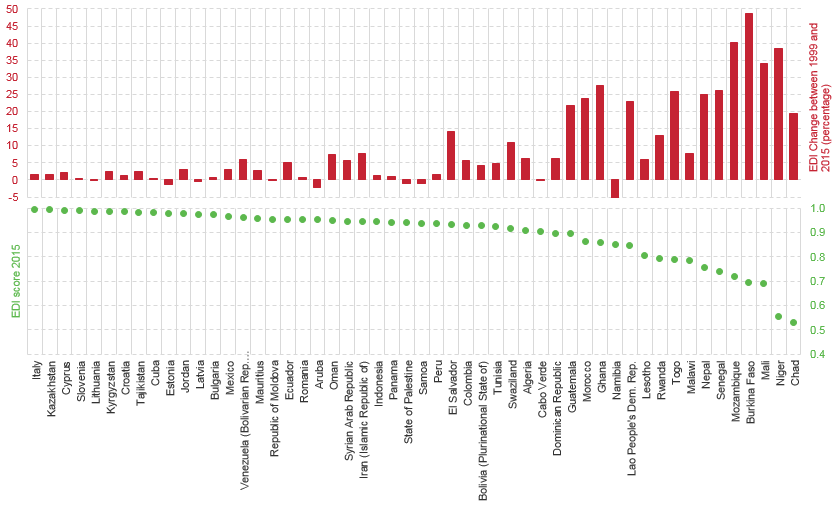
Provision of education is expensive, so it is not surprising that the data suggest that low-income countries experience the most difficulties (see figure 4.1). Of the countries for which there are data, 80 per cent of low-income countries have an EDI score classified as far from EFA
, that is, far from universal education. In fact, two thirds of all countries classified as far from EFA
are low-income countries. The majority of countries classified as intermediate
(86 per cent) are middle-income countries. All of the countries that are close to EFA
are middle- or high-income countries. Three quarters of countries that have reached EFA achieved
are high-income countries.
From a regional perspective, the data are less robust. Nevertheless, some patterns appear to be clear. According to UNESCO (UNESCO Institute of Statistics, 2015) the majority of sub-Saharan African countries (95 per cent) for which data are available are categorized as far from EFA
or intermediate position
– see Burkina Faso, Chad, Lesotho, Malawi, Mali, Mozambique, Rwanda, Senegal and Togo (figure 4.1). For all South and West Asian countries and for three quarters of Arab economies/countries for which there are data, the same situation applies – see the Lao People’s Democratic Republic and Nepal.
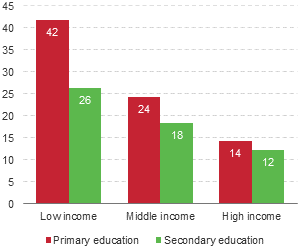
Many factors affect learning experiences. Given the complexity of this field, the pupil–teacher ratio (PTR) The PTR is the average number of pupils per teacher at a specific level of education in a given school year.
more has often been used as a proxy for quality, although it is not clear to what extent the PTR has an affect or what an optimum PTR might be (Whitehurst and Chingos, 2011; Tomlinson, 1988). Apart from acting as a proxy indicator for education quality, PTRs also show how resources are being allocated to education. Again, not surprisingly, the PTR is highest for low-income countries (figure 4.2). For primary schools in 2013, the average PTR was 42 and for secondary schools it was 26. For middle-income countries the respective average PTRs were 24 and 18. For high-income countries the averages were 14 and 12. For low-income countries in particular, the average 2013 PTRs disguise a wide range; for example, in Malawi the secondary school PTR was 70, in Burundi 37 and in Côte d’Ivoire 22. For primary schools in 2013, a similar spread was evident: at 69 Malawi had the highest PTR; Chad and Rwanda also had PTRs in the 60s; whereas Mali had a PTR of 41. Between 2000 and 2013, the PTR improved across all income bands. For secondary schools, the PTRs for low- and middle-income countries improved by roughly 8 per cent, whereas for high-income countries the improvement was a more modest 4 per cent.

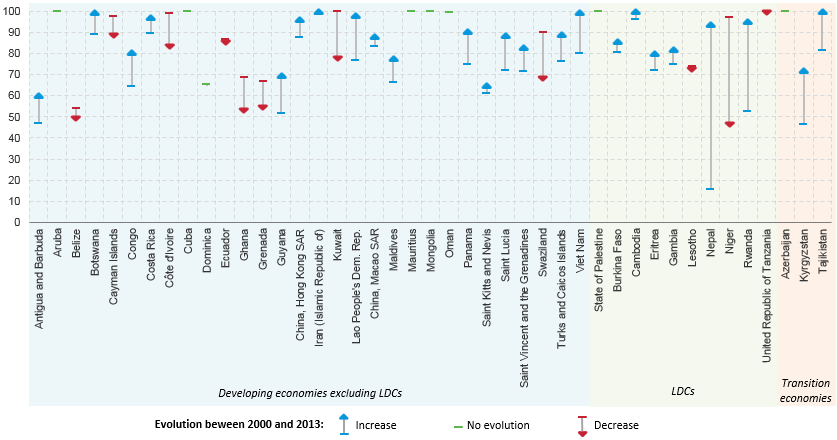
Another very important factor in the provision of education is the availability of properly pedagogically trained teachers. For most high- and middle-income countries, school teachers are trained. Data availability is patchy at best but sufficient to show that the situation is more varied for lower-income countries. For several countries the proportion of trained teachers teaching in primary schools (arguably the most important level) is only around 50 per cent (Antigua and Barbuda, Belize, Ghana and the Niger). While figure 4.3 shows an improvement for the majority of economies, including some dramatic improvements, such as in Nepal and Rwanda, the data also highlight that the situation has deteriorated in others (Cayman Islands, Côte d’Ivoire, Ghana, Grenada, Kuwait, the Niger and Swaziland).