


Goal 17
Partnerships for the goals

The shortfall in the Official Development Assistance (ODA) is a subset of external official aid provided by developed to developing countries. The need to establish a stable flow of ODA was recognized as far back as the 1960s. In fact, a target of official flows equivalent to 0.75 per cent of each developed country’s gross national productIt is defined by the United Nations System of National Accounts 1993 as: GDP less net taxes on production and imports, less compensation of employees and property income payable to the rest of the world, plus the corresponding items receivable from the rest of the world (in other words, GDP less primary incomes payable to non-resident units, plus primary incomes receivable from non-resident units).
more (GNP) was initially adopted at the second conference of UNCTAD in New Delhi in 1968. This proposal was accepted by most, but not all, developed countries; but after further negotiations, this initiative was approved by the United Nations General Assembly on October 1970, although the target was lowered to 0.7 per cent of GNP.
Following a period of decline and stagnation in the 1990s, despite a call for renewed efforts from the Monterrey Consensus on Financing for Development (United Nations, 2003), registered ODA flows to developing countries increased significantly in the 2000s (figure 17.4 and figure 17.5).
ODA, estimated at US$135 billion a year, provides a fundamental source of financing, especially in the poorest and most fragile countries. But more is needed. Investment needs in infrastructure alone reach up to US$1.5 trillion a year in emerging and developing countries. (World Bank, 2015)
Net disbursements by members of the Development Assistance Committee (DAC) of OECD rose from US$89 billion in 2002 to US$134 billion in 2014 (in constant 2013 United States dollar terms) − a 51 per cent increase, though an amount slightly below the record levels in 2010 and 2013. However, this still represents only 0.29 per cent of members’ GNIGross National Income is Gross Domestic Product (GDP) less net taxes on production and imports, less compensation of employees and property income payable to the rest of the world, plus the corresponding items receivable from the rest of the world.
more, which is far short of the committed target of 0.7 per cent of GNI and is lower than the shares in the early 1990s17.18.
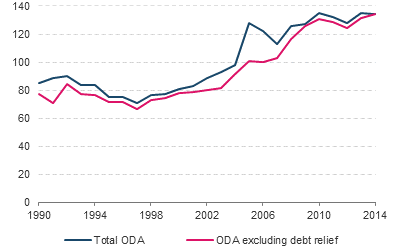
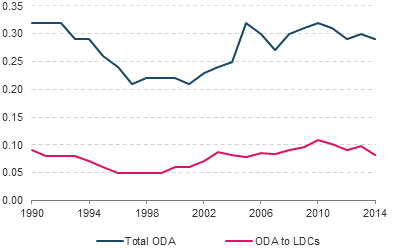
Moreover, this percentage has been on a declining trend since 2010, both for total ODA and for ODA to the LDCs. Around one third of ODA has been directed towards these countries, where, on average, it accounts for over 70 per cent of external financing (United Nations, 2014). In constant dollar terms, it more than doubled between 2000 and 2010, but it has been falling in recent years. Indeed, bilateral aid to LDCs declined by 16 per cent in 2014 (OECD, 2015b).
Moreover, spending plans by major donors suggest that there is unlikely to be a significant growth of ODA flows in the medium term (OECD, 2014b). For a more detailed discussion on this topic, see UNCTAD Trade and Development Report 2015, 17.3 and 17.9.
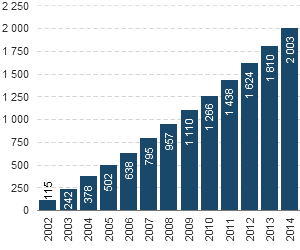
Since the 2002 Monterrey Consensus, approximately US$1.4 trillion in ODA has been delivered, representing an average effort of 0.29 per cent of GNI (figure 17.6). During this period, the gap or shortfall between pledged and delivered ODA, between 0.29 per cent and 0.7 per cent of GNI, equates to just over US$2 trillion (in current prices). The ODA gap for 2014 alone was more than US$192 million17.19.
In 2000, an important milestone was achieved with the adoption of the United Nations Millennium Declaration In this declaration, the international community formally committed itself to the pursuit of sustainable development and poverty eradication. As emphasized by DAC, Development was recognized not as charity from rich countries, but as a collective responsibility that addresses the interests of all the world’s nations by upholding the principles of human dignity, equality, and global equity
(DAC, 2011).