


Goal 9
Industry, innovation and infrastructure
Historically, the countries that have succeeded in achieving sustained economic growth and development are those that have been able to transform their production activities effectively from low to high productivity, and to diversify from the production and export of a single or a few primary products to the manufacture and export of finished products (UNCTAD, 2014d). The need to industrialize remains for many poor countries as they try to catch up with more advanced economies and to improve living standards - an outstanding challenge. Deepening global value chainsThe full range of activities undertaken to bring a product or service from its conception to its end use and how these activities are distributed over geographic space and across international borders.
more, access to knowledge and technology, the risks of climate change, jobless growth in manufacturing, social tensions and the rise of China as the workshop of the world have all been cited as reasons that make it more difficult for late industrializers to export manufactured products on the world market (Szirmai et al., 2013).
Manufacturing value addedManufacturing value added (MVA) is the total value of goods and services net of intermediate consumption. It is generally compiled as the sum of the value added of all manufacturing activity units in operation in the reference period.
more (MVA) is widely used by researchers and policymakers to measure the contribution of the manufacturing sector to the total production of an economy. The basic indicator of a country’s industrialization level is captured with MVA per capita, while MVA growth measures the rate of change of a country at constant prices9.1. The United Nations Industrial Development Organization (UNIDO) Industrial Development Report notes that countries experiencing faster structural change tend to experience faster economic growth. Among different types of structural change, industrialization has been the engine of growth for developing countries (UNIDO, 2016a).
For this reason, IAEG-SDG selected Manufacturing value added as a proportion of GDP and per-capita GDP
as one of two indicators to measure progress9.2. Figure 9.8 illustrates the varying contribution that manufacturing makes to different economies around the world9.3.
In developed countries over the last 40 years, the share of MVA in GDP showed a stable downward trend, while in developing countries it remained unchanged around 20 per cent. Contrary to this overall trend, strong expansion of manufacturing occurred in Africa from the early 1980s to middle of 1990s, in South-East Asia from the 1970s until the 1990s, and in East Asia during one and a half decades starting from the early 1990s (UNIDO, 2016a).
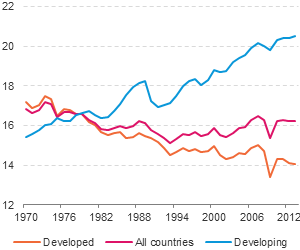
It is noteworthy that, when measured constant prices, the share of MVA in GDP in developing countries shows an increasing, rather than declining, trend (see figure 9.9) (UNIDO, 2016a).
In the least developed countriesThis category was officially established in 1971 by the United Nations General Assembly with a view to attracting special international support for the most vulnerable and disadvantaged members of the United Nations family. Their low level of socioeconomic development is characterized by weak human and institutional capacities, low and unequally distributed income and scarcity of domestic financial resources.
more (LDCs), between 1991 and 2012 the share of industry in overall output increased by 5 percentage points or more (see table 9.2). This change was driven by Asian LDCs and manufactured goods exporters. African and island LDCs (and Haiti) all recorded double-digit changes towards industry, as did exporters of fuel and manufactured goods. By contrast, the economic structure in other developing countries (ODCs) changed relatively little. The growth of industry at the expense of agriculture reflects the transfer of resources from agriculture to industry.
As noted above, IAEG-SDG selected two indicators to measure progress towards this target. The second target is Manufacturing employment as a proportion of total employment
. Since the 1970s, manufacturing has been the source of a relatively high-productivity employmentA work performed for pay or profit. The value is obtained by summing up the number of employed in all manufacturing activities.
more.
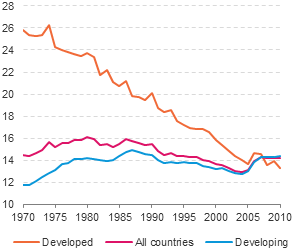
Since the 1970s, manufacturing has been the source of a relatively high-productivity employment. The share of manufacturing in total employment in developed countries (UNIDO's definition) has been steadily declining since 1970s (see figure 9.10). After a 7 percentage-point drop, the manufacturing share in developed Asia is still over 20 per cent, the highest among all regions, including developing ones. In the developed regions of Oceania, Europe and the Americas, the share declined by 15, 13 and 10 percentage points, respectively (UNIDO, 2016a). In developing countries, the manufacturing employment share grew until the late 1980s, and then continuously declined until turn of the millennium. Expansion of manufacturing employment is East-Asia was strongly driven by rapid industrialization in China, where manufacturing employment has increased by 130 million jobs during the past four decades. By contrast, in other developing regions, with the exceptions of Central America and North Africa and Middle East, average manufacturing employment shares in 2010-2013 were lower than those 40 years ago. In sub-Saharan Africa, for example, the share declined although it had already been at a low level (UNIDO, 2016a).
In the LDCs overall structural transformation in employment took place mainly toward the services sector and to a lesser extent towards industry (table 9.3). In all groups of LDCs, defined by main export products, the servicesServices are the result of a production activity that changes the conditions of the consuming units, or facilitates the exchange of products or financial assets.
more sector showed the fastest employment growth exceeding 3 per cent per year (UNCTAD, 2014d). Despite the relatively rapid growth of employment in the industrial and services sectors combined, agriculture, though skrinking, still accounts for the largest share of employement (62 per cent in 2012). Structural transformation proceeded was fastest among manufacturers and services exporters, and slowest among exporters of minerals (table 9.3).