


Goal 8
Decent work and economic growth
During the 25 years from 1990 to 2015, the value of global output from production of goods and services almost doubled, from US$31.1 trillion to an estimated US$59.7 trillion (in 2005 constant prices). With population growth of 38 per cent in the same period, average output per head increased by slightly more than one third (39 per cent) (UNCTADstat, 2016).

Economic growth between 1990 and 2015 was not constant. Rather, four economic cycles can be distinguished (see figure 8.1). A first cycle, which was strongly driven by economic restructuring in Eastern Europe and the former Soviet Union, emerged in the early 1990s and came to a halt around 1998 in response to the Asian financial crisis. A second, more short-lived cycle, emerging from the telecommunications and IT boom, and leading people to speak of a new economy
, started in 1999 and ended in 2001. A third cycle began between the years 2002 and 2004, abetted by financial deregulation, financial innovations and the emergence of multinational value chains, but ended abruptly with the world financial crisis of 2008 and 2009, which threw the world into the deepest recession since the 1930s. A fourth, ongoing cycle commenced with a resumption of economic growth in 2010. To date, this cycle has been characterized by low demand (notably investment demand) and decreasing prices for primary commodities, including oil and gas (UNCTAD, 2015; International Monetary Fund (IMF), 2016a)8.8.
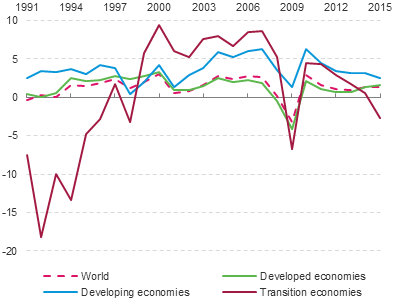
Economic growth in developed economies followed broadly the same trend as economic growth in the world as a whole, as these economies account for around two thirds of global gross domestic product (GDP). In developing economies, the growth rate was for the most part well above that of developed economies, with the exception of the years from 1998 to 2001, when developing economies were adversely affected by the Asian financial crisis. Transition economies experienced a dramatic recession after the breakdown of the socialist system in the early 1990s, experiencing decreases of economic per capita output of up to 18 per cent in a single year. After 1992, however, as economic restructuring continued, economic growth in that region recovered to the extent that in 1999 positive growth returned, and from 2000 to 2008 it was approximately 5 percentage points above that experienced in developed countries. Transition economies initially came out of the world financial crisis with relatively higher growth than the developed ones. Since 2011, however, their GDP-per-capita growth has dramatically declined, apparently in most cases due to falling oil and gas prices. Growth in 2015 is forecast to be negative (see figure 8.2).
The average annual growth of per-capita GDP during the period 1991 to 2015 in developed economies was 1.4 per cent, 1.7 per cent in transition economies and 3.6 per cent in developing economies (UNCTADstat). The relatively strong growth in the poorer countries may be an indication of beta-convergenceBeta-convergence applies if a poor economy tends to grow faster than a rich one
more8.9, a process that leads to reduction in disparities in GDP-per-capita levels. Empirically, beta convergence is confirmed by the fact that from 2001 to 2015 the growth rate of the individual countries’ GDP per capita was negatively correlated with the level of GDP per capita in 2001 (correlation coefficient: -0.40, based on data from UNCTADstat, 2016)8.10. While it is difficult to find developed economies where growth of GDP per capita exceeded 4 per cent within a single year - exceptions can be found in some eastern member States of the European Union as well as in Ireland during the 1990s - growth of that magnitude occurred more often in transition and developing economies. While after the turn of the millennium almost all transition economies showed high per-capita GDP growth, in developing economies growth was geographically dispersed. During most of the period from 1991 to 2015, strong GDP growth was concentrated in a limited number of developing countries, primarily in East Asia and East Africa, with the exception of the period from 2002 to 2009 when it reached out to other countries, including those in West Africa and South America.

Target 8.1 calls for GDP growth rates exceeding 7 per cent in least developed countries (LDCs). Growth rates of that scale were indeed not exceptional within that group of countries during the last 25 years - 37 out of the 41 LDCs experienced growth rates of that magnitude or more at least once during the period, 13 of them over five or more years consecutively (see table 8.1). The most impressive growth was enjoyed by Equatorial Guinea, where a sustained economic growth lasted for 14 years from 1992 to 2005, resulting in an expansion of the economy by a factor of 20. In Myanmar, GDP growth remained high from 1999 to 2014, with the effect that GDP tripled. In Ethiopia, GDP has now been growing strongly for the past 11 years, with rates well above 7 per cent, in most years higher than 10 per cent. And in the Lao People’s Democratic Republic, growth rates have been remaining slightly above 7 per cent for 10 years in a row. In all of these cases, the growth in GDP was only partly offset by population growth.