


Goal 17
Partnerships for the goals
The concept of policy coherence for development (PCD) emerged in international discourse during the 1990s in the context of increasing global challenges and growing concerns regarding the effectiveness of development aid. It was increasingly recognized that improving policy coherence would expedite positive synergies and spillovers across public policies designed to foster development (OECD, 2012). While there is no single agreed definition of PCD, it is generally accepted that it means that while pursuing domestic policy objectives, governments should at a minimum avoid negative consequences and spillovers which would adversely affect the development prospects of poor countries. PCD also means that, when formulating domestic policies, governments should actively look for ways to exploit the potential for positive spillovers and build synergies between different policies to benefit developing countries (EuropeAid, 2013). OECD has formally defined PCD: Policy coherence means different policy communities working together in ways that result in more powerful tools and products for all concerned. It means looking for synergies and complementarities and filling gaps among different policy areas so as to meet common and shared objectives
(OECD, 2002).
The 17 Goals and 169 targets of Agenda 2030 highlight not just the breath in scope of the development agenda but also its inseparable multidimensionality and complexity. Ensuring policy coherence between policy measures is not only complex to achieve but also difficult to measure. Although PCD was enshrined in the Millennium Development Goals process, in European Union treaties and in various OECD and international declarations, actual research investment on PCD has been minimal. Thus to date, with the exception of the Commitment to Development Index (CDI), there has been little progress made on developing an internationally agreed policy coherence index (European Centre for Development Policy Management, 2012).
Beyond political will and economic foresight, an effective government needs a coherent approach to international trade and development in order to turn the poetry of political campaigning into the prose of policy implementation. Mukhisa Kituyi, Secretary-General of UNCTAD
The European Centre for Development Policy Management discusses the challenges of building a PCD index to evaluate and compare donor policies beyond simple quantification of official development assistanceThe flows to countries and territories on the DAC list of ODA recipients and to multilateral institutions.
more (ODA) contributions. The authors of the cited study note that construction of such an index presents a number of technical challenges, such as, determining complex chains of causality
17.46 and trade-offs between development objectives
17.47. The authors also draw attention to the challenges of ensuring the quality of the index, the problems of data gaps and the risk that poor data availability may drive such an index, leading to the neglect of important dimensions which cannot be quantitatively measured. Also discussed are the pros and cons of compiling a composite index, a portfolio of indicators, or taking a hybrid dashboard approach. The authors also note that a PCD index can only be successfully realized if there is sufficient political will and a genuine interest among countries to be compared
and stated that, in 2012, there appeared to be insufficient political support for an internationally recognized and institutionalized approach
. Roodman also discusses the difficulties of compiling a policy coherence index, noting in particular the absence of a conceptual framework (Roodman, 2013).
The indicator Number of countries with mechanisms in place to enhance policy coherence of sustainable development
was selected by the Inter-agency Expert Group on Sustainable Development Goal Indicators (IAEG-SDG) to measure progress for target 17.14. Unfortunately, at the time of writing no data are available to compile such an indicator. The indicator itself also requires further clarification before data collection or statistical derivation can begin, as it is not clear what policies are within scope. Furthermore, it is not clear whether policy coherence should relate only to aid and cooperation or should have a much broader range, including all policies that might impact on sustainable development17.48. As Martínez Osés notes, policy coherence still lacks a conceptual definition (Martínez Osés, 2015). For example, concept can be considered from the perspective of internal coherenceCoherence and consistency between the goals and objectives, modalities and protocols of the development policy itself.
more, intragovernmental coherenceConsistency of policies and actions across countries in terms of their contributions to development, to prevent one from unnecessarily interfering with, or failing to reinforce, the others.
more, multilateral coherenceConsistency across policies and actions of bilateral donors and multilateral organizations to ensure that policies adopted in multilateral forums contribute to development objectives.
more and developing country coherenceConsistency between developing countries’ policies and the wider international climate.
more. Equally, coherence can be assessed in terms of outcome17.49, policy output17.50, policy input17.51 and policy stance indicators17.52. An agreed definition of sustainable development
will also need to be agreed upon.
For the purposes of this exercise, the CDI, developed by the Centre for Global Development in 2003, is used. Originally known as the “Ranking the Rich” index17.53, it provides a country-by-country overview for most OECD aid donors with the aim of reminding the world that reducing poverty in developing countries is about far more than giving money
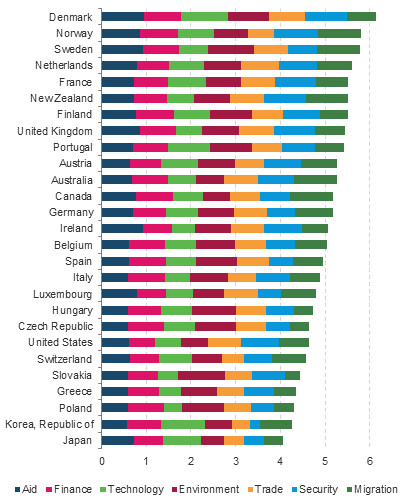
(Krylová and Barder, 2015). The 2015 edition includes 27 of the world’s richest countries. The CDI is a composite index incorporating seven policy dimensions: aid17.54; trade17.55; investment17.56; migration17.57; environment17.58; security17.59; and technology17.60 (for more details see Roodman, 2013). So for example, the index gives credit for generous and high-quality aid, policies that protect the environment or open and fair trade policies. Scores are reduced for policies such as barriers to imports from developing countries, selling arms to poor and undemocratic nations, barriers to sharing technology or policies that harm shared environmental resources. These components are then averaged to calculate a final country score. Scores are weighted for economic size to assess whether countries are living up to their potential to help
. The aim is to quantify the effect of these policies on developing countries.

In 2015, Denmark has the best overall score because of a consistent performance across all the components of the index, but in particular aid17.61 and technology (figure 17.25). Of the 27 countries included in the index, Japan was ranked last overall owing to poor scores for environment, trade and security.
Trade provides poorer countries with opportunities to attract investment, create jobs and reduce poverty. Nevertheless some goods and services produced by developing countries still face trade barriers and less obvious non-tariff barriersA non-tariff barrier is a form of restrictive trade where barriers to trade are set up and take a form other than a tariff.
more in developed economies, making it difficult for developing countries to complete and reap the benefits of international trade. The CDI rewards developed countries that are open to goods from developing countries, with low tariffs, no or few subsidies, and streamlined importation processes. The 2015 index ranks the Netherlands, Denmark and the United Kingdom at the top of the trade sub-index, owing to their limited red-tape procedures and openness to trade in services. Japan and the Republic of Korea are ranked lowest owing to their high tariff rates on rice and the latter’s tariffs on grains, seeds and nuts.
The debate and measures regarding policy coherence have to date largely focused on the narrow issue of aid effectiveness. But the profound impact of multiple and interrelated global crises (financial, economic, food and energy) on the world’s poorest and the increased countries’ interdependency, meaning that the impacts of policies put in place by any one country are felt far beyond that country’s borders, demonstrate the need for the development community to go beyond aid
(OECD, 2012). In this increasingly globalized world, achieving the Sustainable Development Goals universal agenda requires policy coherence at all (national, regional and global) levels
(UNCTAD, 2016b). The scale of the Sustainable Development Goals means a broader concept of policy coherence and accompanying measurement tool than used to date is required17.62.