

Goal 10
Reduced inequalities
In order to measure inequality, statistical measures need to be specific. Different dimensions of inequality, such as income, wealth, power, occupation prestige, education, gender, race or ethnicity all have different measures. Depending on what precisely is to be measured, a variety if indexes can be used10.5.
We are living through a new gilded age exceeding the gaudy excesses of the 1870s and the 1920s. The extent of riches at the top of the income and wealth distributions is unimaginable.Sachs (2011)
The Gini indexNamed after Italian statistician Corrado Gini, the Gini index (or coefficient) is a measure of statistical dispersion used to measure inequality among values of a frequency distribution.
more is a widely used indicator of income inequality or wealth concentration within an economy or society. It indicates how far the distribution of income among individuals (or households) deviates from a perfectly
egalitarian distribution. The Gini index is not a perfect measure of inequality, however10.6. It has some undesirable characteristics; not least, it has been criticized for being more sensitive to changes in the middle of the distribution, rather than the tails where the focus should be placed. It has also been criticized for being difficult to interpret.

Other measures of inequality, such as the poverty headcount ratioThe national poverty headcount ratio is defined as the proportion of people living below national poverty lines.
more and the Palma indexThe Palma index is the ratio of household incomes of the two tails of an income distribution and it compares the income inequality between the two groups.
more, are intuitively more appealing than the Gini index and do not require knowledge of Lorenz curvesDeveloped by American economist Max Lorenz, the Lorenz curve is a graphical representation of the distribution of income or wealth.
more. Like the Gini, the poverty headcount ratio and Palma index are measured from income distributions of national household survey data. The Inter-agency Expert Group on Sustainable Development Indicators (IAEG-SDG) has adopted the poverty headcount ratio of people living under 50 per cent of national median incomeA median: the value of the variate which divides the total frequency into two halves.
more as the indicator for target 10.2. An empirical comparison of poverty headcount ratios across countries is not straightforward either, as two different types of household surveys, income and consumption, are used as data sources10.7. Cross-country comparisons of inequality, therefore, require some caution10.8.
A Palma indexThe Palma index is the ratio of household incomes of the two tails of an income distribution and it compares the income inequality between the two groups.
more for the latest years available is presented in figure 10.2. The average Palma index value of 121 countries was 7.8 and the middle value of the index (median, 50 percentile) was 6.1. Forty-five countries scored Palma indices lower than 5.4 and the average incomes of the richest 10 per cent were 3.6 to 5.4 times more than those of the poorest 40 per cent in the respective distributions, indicating lower concentrations of income/consumption in these countries. Income inequalities within African and developing American countries are on the decline, but remain at a high level. The richest 10 per cent in Brazil, Colombia, Haiti, Honduras and Panama have at least 15 times higher average per capita income than the poorest 40 per cent. In Africa, Botswana, Lesotho, Namibia, South Africa and Zambia have income inequalities in the same range. At the other end of the spectrum, Belarus, Norway, Slovakia, Slovenia and Ukraine have low index values.
Although it is possible to locate where the income inequality exists in the world, household survey statistics usually do not provide information on the age or gender inequality of poverty, as the unit of measurement is the household. Study at the individual level provides better insights into gender inequality. According to the Millennium Development Goal Report 2015, a recent study reported that, in 41 out of 75 countries, women were more likely to live in poverty than men. Moreover, a higher prevalence of households headed by women10.9 was found in countries where women are over represented in the lowest wealth quintile of households10.10, indicating a greater risk of poverty for such households10.11.
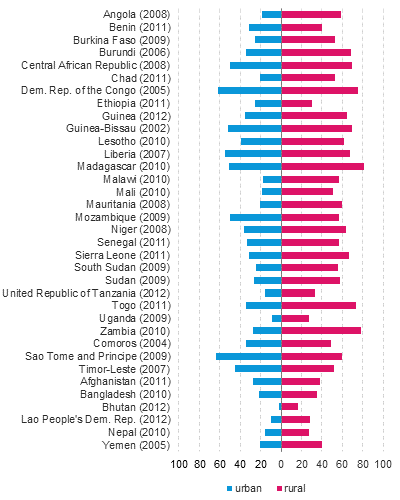
In least developed countries (LDCs)The category of Least Developed Countries (LDCs) was officially established in 1971 by the UN General Assembly with a view to attracting special international support for the most vulnerable and disadvantaged members of the UN family.
more, nearly half of the populations live in extreme poverty and the majority reside in rural areas. Reducing rural-urban inequality will be of crucial importance for these countries if Agenda 2030 is to be achieved. In almost all LDCs for which data are available, the poverty headcount ratioThe national poverty headcount ratio is defined as the proportion of people living under below national poverty lines.
more (national poverty line) in rural areas was higher than in urban areas, often more than double (figure 10.3). This rural-urban pattern of extreme poverty in LDCs contrasts with emerging global trends of poverty urbanization. Greater increases in income in rural areas will be required to eradicate extreme poverty in LDCs (UNCTAD, 2015a).
The United Nations (2015a) projects that the populations will continue to grow at high rates in the LDCs (see Special note on population). Although the growth rate of the LDC group is expected to slow down from the current 2.4 per cent per annum, the absolute population is projected to reach 1.3 billion by 2030, up from 954 million in 2015 (a growth of 40 per cent). The working-age population10.12 of LDCs is expected to increase from 521 million in 2015 to 764 million in 2030 (plus 47 per cent), of which approximately 33 per cent will be youths10.13. The size of the rural population in LDCs is projected to grow by about 70 per cent, although the proportion of rural population is expected to decrease from the current 69 per cent to 62 per cent by 203010.14. Agriculture remains the main source of income for women in LDCs, and the majority work in the agriculture sector10.15. With continuing population growth, the governments of LDCs face the challenge of meeting the Sustainable Development Goals and ensuring that no one is left behind. Achieving the Goals will be more demanding since a rapid growth in the rural workforce10.16 will require governments to provide greater economic opportunities in order to provide incomes above the poverty line (United Nations, Department of Economic and Social Affairs, 2014; UNCTAD, 2015a; United Nations, 2015a).