

Goal 10
Reduced inequalities
Inequality, and how it affects economies and societies, is a growing concern shared by politicians, economists and the global community. There is an emerging consensus that existing levels of inequality are not only morally unacceptable, but also economically and politically damaging (UNCTAD, 2013a).
Intellectual and political debate about the distribution of wealth has long been based on an abundance of prejudice and a paucity of fact. Piketty (2013)
Hence the growing interest in trying to assess whether globalization and new technologies have exacerbated or improved the situation. Inequality has implications far beyond simple economic development, as it is recognized that it can be damaging to society, even threatening peace and security. Resentment over injustice, unequal access to public goods or social services, or political or social exclusion may all trigger unrest, hostility and violence (Brinkman et al., 2013).

Definitions of inequality typically refer to an absence of equal dignity, status, rank, privileges, rights or opportunities with others. They often also refer to lack of equal chance and rights to seek success in one’s chosen sphere regardless of social factors such as class, race, religion and sex10.1. Inequality is often a complex amalgam of social, political and economic factors. Goal 10 reflects this broad spectrum, setting a series of targets promoting income growth, social and economic inclusion, equal opportunity, wage and social protection, improved financial regulation, safe migration of people and an improved representation for developing countries in decision-making and global international institutions.
But trying to assess whether global inequality is increasing or decreasing is not a straightforward task. What type of inequality is being assessed? If the aim is to determine whether economic inequality is improving or not, then some internationally comparable measures of income and or consumption must be agreed upon. These measures must also allow for comparison over time. Further, should the measure compare inequality between countries or simply between all of the people in the world? Not surprisingly, inequality can be measured in a variety of ways10.2 and many of the measurement instruments are not without problems and biases10.3.
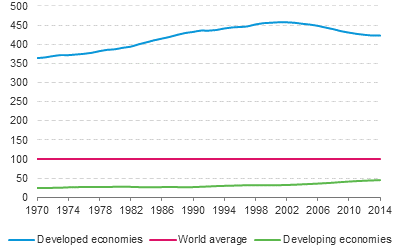
Figure 10.1 presents a simple, if crude, measure of global economic inequality. Using gross domestic product (GDP) per capita at constant prices as the basis for comparison, the contribution of the developing10.4 and developed economies is benchmarked against a world baseline. From this narrow perspective, inequality between developing and developed countries has been declining since the 1970s, but very noticeably since the end of the twentieth century.
The trend illustrated in figure 10.1 captures the ascent of the developing world or the South (Radelet, 2015). In 1970, developing economies accounted for 17 per cent of global GDP, by 2014 their contribution had doubled to 34 per cent. This shift has led to an entire middle class in the North having to lower their expectations of a constantly better life
as a new poor elite
from the South gets rich (at their expense) at a faster pace than probably ever experienced by such a large group of people in history (Bhalla, 2002).