


Goal 17
Partnerships for the goals
Following the Great Depression of the 1930s and the onset of World War II, GDP emerged from these crises and the Bretton Woods conference in 194417.94 as the pre-eminent economic indicator (Dickinson, 2011; Fioramonti, 2013) and the ultimate measure of a country’s economic progress. GDP has been described by Samuelson and Nordhaus as one of the greatest inventions of the twentieth century (Landefeld, 2000). As Philipsen notes, GDP is not just a measure of the economy. It defines the economy
(Philipsen, 2015). Although a purely economic measure, GDP has often been used as a proxy measure for welfare. Palmer described GDP as the chief criterion for national welfare or progress
(Palmer, 1966). Landefeld notes similarly the singular focus on GDP alone as a measure of society’s welfare
(Landefeld, 2010). But from the outset, Simon Kuznets, the economist most commonly associated with the creation of GDP, cautioned that GDP could unwittingly act as a statistical laundry
concealing inequality and would be an unreliable or inappropriate measure of well-being, noting the welfare of a nation can scarcely be inferred from a measure of national income
(Kuznets, 1962, p. 29). More recently Stiglitz has gone further, reflecting concerns with the limitations of GDP, saying that not only is GDP not a good measure of welfare but GDP is not a good measure of how well an economy is performing
and that too much has already been sacrificed on the altar of GDP fetishism
(Stiglitz, 2014)
We need to move beyond gross domestic product as our main measure of progress, and fashion a sustainable development index that puts people first. Ban Ki-moon, Secretary-General of the United Nations (Ban Ki-moon, 2012)
There have been many attempts since the 1970s to move beyond GDP, such as: the Measure of Economic Welfare17.95; the Total Incomes System of Accounts17.96; the Index of Sustainable Economic Welfare that was later renamed the Genuine Progress Indicator (GPI); and perhaps most famously, the Index of Gross National Happiness proposed by the King of Bhutan. The essence or spirit of these alternatives was perhaps best encapsulated by Robert F. Kennedy referring to GDP during a 1968 campaign speech in the University of Kansas - it measures everything in short, except that which makes life worthwhile
. But it was the financial crash of 2008 and the subsequent recession that triggered a determined attempt to develop a more wide ranging measure of progress. The Commission on the Measurement of Economic Performance and Social Progress (better known as the Stiglitz-Sen-Fitoussi Commission) was established by the then president of France, President Sarkozy, in 2008 to determine if a better or more comprehensive measure of economic and social progress could be established. This commission reported in 2010 (Stiglitz et al, 2010). In 2009, the European Commission published their initiative Beyond GDP
, which is an amalgam of enlarged GDP
, social and environmental indicators and other measures of well-being. The Obama administration formally established the Key National Indicators Commission in 2010 to develop a comprehensive indicator system for the United States, which comprises over 300 key and 12 composite indicators. The following year OECD launched its Better Life Index
to try and address similar questions. Ban Ki-Moon, the Secretary-General of the United Nations, noted the importance of establishing a Sustainable Development Index, or a set of indicators to measure progress towards sustainable development
(United Nations, 2012). Separately, the United Nations University International Human Dimensions Programme on Global Environmental Change in collaboration with the United Nations Environment Programme has also developed an Inclusive Wealth Index.
A challenge for statisticians is how to interpret progress on sustainable development
, as several disparate issues are potentially bundled under the broad progress
umbrella, including resource depletion, environmental degradation and sustainability, well-being, social inequality, societal satisfaction and economic performance, stability and sustainability. Furthermore, each of these is individually complex and multidimensional. As noted above, several indicators have been developed, and, reflecting this complexity, some have adopted a dashboard approach rather than trying to develop a single aggregate index. Whether to use a dashboard or a composite indexA composite indicator is formed when individual indicators are compiled into a single index, on the basis of an underlying model of the multi-dimensional concept that is being measured.
more is not a straightforward decision. Dashboards are perhaps more transparent but often pose communications challenges, whereas single composite indices appear simpler but often involve technical weighting decisions that may have significant impact on the result. The timeliness of these more complex indices (whether dashboard or composite) poses another challenge as they are dependent on so much more data, many of which may be significantly lagged after the reference period.
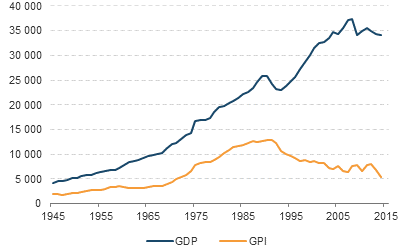
For the purposes of illustration, the GPI for Finland is compared with the GDP in figure 17.31. The GPI begins with the same data used to compile GDP but is then adjusted for income distribution, housework, volunteering and higher education, crime, resource depletion, pollution and long-term environmental damage, changes to leisure time, defence expenditure, lifespan of consumer durables, public infrastructure and dependence on foreign assets. As both GDP and the GPI are measured in monetary terms, they can both be compared on the same scale.
Figure 17.31 shows the widening gap between GDP and GPI as the GPI has followed a more subdued trajectory than that of GDP, highlighting the impact of accounting for hidden costs
. There is a pronounced growth in the gap from the early 1990s. The gap between the two measures peaked in 2007 at almost €31,000 per capita before falling back slightly. But the steady separation of the two measures resumed in 2012 with the gap estimated at almost €29,000 in 2014.
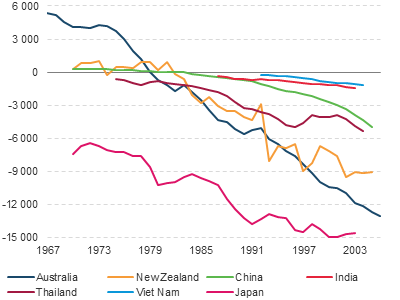
The trend illustrated for Finland is not unique. Figure 17.32 presents the gap between GPI and GDP (GPI minus GDP) for Australia, China, India, Japan, New Zealand, Thailand and Viet Nam. For all of these countries, a growing distance between the two measures is evident. For Australia, China and New Zealand, where long time series are available, the gap was initially positive (during the late 1960s and 1970s). But the gap for all three countries became negative between 1980 and 1982. In Japan the GPI GDP gap has been negative from inception. The declining trend (growing gap) is evident for all selected countries but is particularly striking for Australia. The trend for Japan and New Zealand is quite similar, although the scale of the gap is significantly more pronounced for the former. The steepening curve for China is also noteworthy.
As noted above, there are several measures that can be used to complement, or even replace, GDP as the best collective measure of progress or well-being. But for the moment GDP remains the prominent measure as there is little consensus on which of these alternatives is the most suitable replacement. As has been observed, this is because there is little consensus on how well-being should be measured and whether quantitative measurements can be made at all. Talberth et al. (2006), using GPI as an example, illustrate how different key indicators might look and how changed our perceptions of progress might be using such an approach.