


Goal 3
Good health and well-being

Today people are living longer. In developing countries, this is mainly as a result of reductions in childbirth and childhood mortality and improvements in the eradication or reduction of infectious diseases. In developed countries, there has been a steady increase in life expectancy owing to declining mortality among the elderly. Combined, these changes are leading to a significant shift in demographic patterns, with important implications for dependency ratiosDependency ratio (sometimes known as total dependency ratio or age dependency ratio) is defined as the ratio of the number of children (0–14 years old) and older persons (65 years or over) to the working-age population (15–64 years old). In other words, it is the ratio of dependents to the working or productive cohort of the population.
more, the length of working lives, and pension and health-care provision (see special note on population). Figure 3.1 presents a simple global, health and wealth chart mapping of life expectancy at birth cross-referenced with gross domestic product (GDP) per capita for the period 1990–2013. Although not an official Sustainable Development Goal indicator, this presents a reasonably good summary of the trends of global heath and its relationship with economic performance over the past 24 years.
The general evolution in figure 3.1 shows a tightening or clustering of countries towards the top right-hand corner, signifying a general improvement in income and life expectancy. But the chart also shows that since 1990 there has been uneven progress across the regions of the world. Throughout Asia there has been a general improvement, and in particular for countries like Israel, Japan, Qatar and Singapore. But it is also evident that some countries, such as Afghanistan, have experienced notable gains in life expectancy but not in income.
In Africa, there have been some dramatic improvements, most notably for Equatorial Guinea, but generally while improvements have been made for many African countries on the health front, there has been less progress regarding wealth. Despite individual improvements, it is also evident that many African countries, as signified by their position in the bottom left-hand corner of the chart, have below-global-average income and health outcomes. In Oceania, improvements in health and wealth are very evident in Australia and New Zealand, but much less so for the remaining Pacific islands. Within Europe, improvements are clear across the entire region, but once again uneven progress can be seen, in particular less progress is evident for parts of Eastern Europe and the former Soviet Republics. In the Americas, Canada has made steady improvements whereas Haiti has not.
The importance of physical health has been long recognized, but in recent years there has been increasing attention given to improving our understanding of what constitutes subjective well-being
and the factors that influence it. There is, however, no international consensus on how to define well-being. This is not surprising, as many cultural elements impact on it. Nevertheless, there appears to be broad agreement that well-being is made of positive emotions and moods (for example, contentment and happiness), the absence of negative emotions (for example, depression and anxiety), satisfaction with life and general fulfilment. Thus, well-being is a complex mix of physical, psychological, emotional, social and economic health. Typical dictionary definitions tend to describe well-being as a good or satisfactory condition of existence; a state characterized by comfort, health, happiness, and prosperity or welfare. Not surprisingly, there continues to be much debate about how to define well-being and how to measure it.

More recently, the quest to understand and measure well-being has become intertwined with the idea of human progress and sustainability. This has led to the development of several competing indicators, all attempting in one way or another to provide metrics on human well-being and socioeconomic progress3.1. Some of the better-known indices include the Organization for Economic Cooperation and Development Better Life Index, the United Nations Environment Programme Inclusive Wealth IndexThe United Nations University International Human Dimensions Programme and United Nations Environment Programme Inclusive Wealth Index is a composite index covering 140 countries providing a metric on global wealth, sustainability and well-being.
more, the United Nations Development Programme Human Development IndexThe United Nations Development Programme Human Development Index is a composite index measuring average achievement in three basic dimensions of human development: a long and healthy life; knowledge; and a decent standard of living.
more, the Genuine Progress Indicator (Talberth et al., 2006) and the index of Gross National Happiness.
Each measure of well-being will indicate different degrees of progress depending on the lens through which progress is being examined. From a global perspective, many of the overall patterns, irrespective of the index used, are quite similar. The adjusted Inclusive Wealth IndexThe United Nations University International Human Dimensions Programme and United Nations Environment Programme Inclusive Wealth Index is a composite index covering 140 countries providing a metric on global wealth, sustainability and well-being.
more, which attempts to capture the interdependencies of economy, society and environment, provides one version of progress. While one may argue with elements of the index, the regions identified as vulnerable are consistent with many of the other measures noted above. Over a 20-year time horizon, from 1990 to 2010, gains in wealth, as defined and measured by the adjusted Inclusive Wealth Index, appear to be generally confined to the northern hemisphere (with a few southern-hemisphere exceptions, such as Kenya, the Bolivarian Republic of Venezuela and Zimbabwe). The most evident declines arise in the Plurinational State of Bolivia, China, India, Indonesia, Myanmar, Paraguay, Peru, Thailand and throughout much of Sub-Saharan Africa. It is noted by the 2014 Inclusive Wealth Report (United Nations University International Human Dimensions Programme and United Nations Environment Programme, 2014) that during this period human capital generally contributed to a growth in inclusive wealth, whereas depreciation of natural capital generally contributed to a decline. Figure 3.2 presents four distinct five-year time periods, running consecutively from 1991 to 2010, allowing a more nuanced examination of the trends. For example, in each of the four periods China experienced negative growth of inclusive wealth. The Russian Federation enjoyed a growth in inclusive wealth, but at a declining rate for the first 10 years (1991–2000) before experiencing a decline in inclusive wealth for the subsequent 10 years. The pattern in Canada and the United States of America was the opposite – in these countries negative inclusive wealth growth in the first decade turned positive in the second (2001–2010). India experienced negative growth for the first three periods but inclusive wealth grew in the last period, arising from progress in human capital. In general, most countries in sub-Saharan Africa for which there are data were more or less consistently negative throughout – but with some important exceptions, such as South Africa.

There is, of course, an important trade element to health and well-being, both in terms of health and medical tourismHealth and medical tourism is undertaken when people cross international borders for the exclusive purpose of obtaining medical or health services. This includes, for example, purchasing services from hospitals, clinics, convalescent homes and, more generally, health and social institutions.
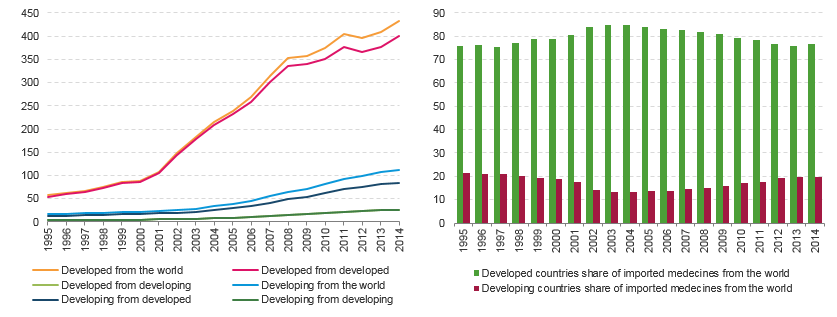
more and also in terms of the international trade in essential vaccinations, medicines and other health care products. Trade can play a vitally important role in making affordable medicines available to developing countries. Figure 3.3 illustrates the value of imports of total medicines3.2 between developed and developing economies over the past twenty years. In 1995, developing economies imported approximately US$16 billion worth of medicines, accounting for almost one quarter of global imports of medicines. In 2014, the overall situation had not changed significantly; developing economies imported medicines valued at about US$112 billion, accounting for about 23 per cent of global imports of medicines.
The international trade of medicines cannot be properly analysed or understood without considering price. To assess the impact of trade in medicines on drug affordability and accessibility to populations in developing countries, it is necessary to study how the price of medicine varies across countries and levels of gross national incomeGNI is GDP less net taxes on production and imports, less compensation of employees and property income payable to the rest of the world, plus the corresponding items receivable from the rest of the world.
more (GNI). Using the price and availability of direct-acting antiviral drugs (DAA), specifically those used in the treatment of hepatitis C virus (HCV) as an example, the importance of price (and by extension trade) may be outlined. HCVHepatitis C is a liver disease caused by HCV: the virus can cause both acute and chronic hepatitis infection, ranging in severity from a mild illness lasting a few weeks to a serious, lifelong condition.
more treatments provide a good case study as hepatitis C is a major affliction in developing countries but is also quite prevalent in developed countries, thus allowing comparisons between the two development categories.
A study by Andrieux-Meyer et al. (2015) on the correlation between GNI and the price of HCV treatments found substantial variabilities in the price of several HCV drugs3.3 within developed countries (where little correlation between drug prices and GNI was evident) and between high- and middle-to-low-income countries, where prices were generally substantially lower. While in general the study showed that DAA prices are higher in high-income countries and lower in low-income countries, a number of outliers, such as Malaysia and Turkey, where drug prices appear to be unusually high, are identified. Additionally, the study shows that price differentiation mechanisms may discriminate against developing countries. For example, Côte d’Ivoire pays almost three times as much for the generic equivalent of sofosbuvir as India (US$500 compared with US$161 per bottle) despite having a lower GNI. In another example, the authors identify that South Africa pays US$6,100 per bottle for simeprevir compared to only US$1,000 in Brazil, despite again having a lower GNI (see figure 3.4.b). The authors conclude by noting the poor availability of DAAs generally in low-income countries, the high diversity of market prices across countries in all income brackets, and that manufacturing costs of DAAs are estimated to be far lower than current market prices. The authors also highlight the importance of patent and licence barriers to using branded and generic DAAs (see Goal 17 target 11).