

Goal 6
Clean water and sanitation

Water is a fundamental element of life and clean drinking water a basic requirement for survival. W. H. Auden once reflected that Thousands have lived without love, not one without water
. Yet today, despite all the achievements of mankind, more than 660 million people do not have access to this most basic of requirements.
The targets under Goal 6 call for a variety of actions. They include the universal and equitable access to safe drinking water, equitable sanitation and hygiene, reduced pollution and dumping in our waters, improved water management and sharing, and the protection of aquifers and wetlands. This variety illustrates the importance of water and sanitation for health and the environment and also for property rights and international peace and cooperation. There is a very close link between Goal 6 and Goal 1, and in particular target 1.4By 2030, ensure that all men and women, in particular the poor and the vulnerable, have equal rights to economic resources, as well as access to basic services.
more that deals with access to basic services.
The Millennium Development Goals identified water as an environmental issue, as does the 2030 Agenda, placing water under the theme "Planet". In fact, the importance of water is truly cross-cutting and is crucial to the success of not only "Planet" but also "People", "Prosperity", "Peace" and "Partnership". But the management of water, a public good, often suffers from what is known by economists as the "tragedy of the commons"It was coined by biologist Garret Hardin in 1968 (Hardin, G. 1968). It describes a problem that occurs when individuals exploit a shared resource to the extent that demand overwhelms supply and the resource becomes unavailable to some or all.
more. This has arisen as many have mistakenly assumed that the supply of clean water is limitless and free. It is not. Furthermore, supposed aphorisms, such as 'flowing water purifies itself every 10 miles', in today’s highly populated planet are also clearly false.
The Millennium Development Goals set out to reduce by half the proportion of people without sustainable access to safe drinking water and basic sanitation by 2015 (target 7.C). This was achieved. Globally, between 1990 and 2015 the proportion of people with access to improved drinking water sourcesOne that, by the nature of its construction and when properly used, adequately protects the source from outside contamination, particularly faecal matter.
more increased from 76 per cent to 91 per cent. This means that 2.6 billion people more had access to safe drinking water.
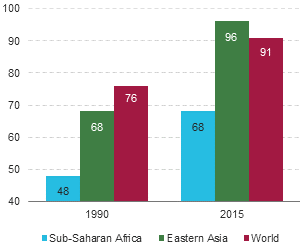
But improvements were even more dramatic in some regions (figure 6.1), most notably sub-Saharan Africa, where less than half of the population had access to safe water in 1990 compared with more than two thirds (68 per cent) today. Countries in Eastern Asia also enjoyed striking improvements so that now almost all of the population in this region (96 per cent) has access to safe water.
Figure 6.2 illustrates the advancements in access to improved drinking water sourcesOne that, by the nature of its construction and when properly used, adequately protects the source from outside contamination, particularly faecal matter.
more at the level of countries, cross-referenced with gross domestic product (GDP) per capita. In some countries there have been some notable improvements in the availability of safe water. In Myanmar, 80 per cent of the population had access to potable water in 2014 compared with only 58 per cent in 1990. Significant improvements are also evident in Mali, where 75 per cent of the population now enjoys access to clean water compared with only 27 per cent in 1990. Even more striking progress is evident in Afghanistan, where more than half the population now has access to water (55 per cent) compared with only 20 per cent twenty years ago. Overall, despite an apparent correlation between GDP per capita and access to safe water, many countries improved their access to drinking water by much more than that correlation would suggest.
But work remains to be done, for as we have seen with other Millennium Developments Goals and targets, progress is uneven. Almost one in three people living in least developed countries (LDCs)The category of Least Developed Countries (LDCs) was officially established in 1971 by the UN General Assembly with a view to attracting special international support for the most vulnerable and disadvantaged members of the UN family.
more still do not have access to clean, safe water (Joint Monitoring Programme, 2015). Access to clean drinking water remains a particular challenge for many countries in Oceania. For example, in 2014 only just under 70 per cent of the population of Kiribati and 40 per cent of Papua New Guinea enjoyed access to clean water. In some sub-Saharan African countries (Angola, Chad, the Democratic Republic of the Congo, Madagascar and Mozambique) every other person does not have access to safe drinking water. It is worth noting that in several other countries, such as Burundi, Cameroon, the Congo, Guinea, Liberia, Mali, Rwanda and Zimbabwe, one in four people do not have access to safe drinking water and for a number of other countries there are no data available. In Equatorial Guinea, despite notable improvements in income, only half the population has access to clean water with no appreciable improvements in availability. Problems persist also in Afghanistan, Haiti, Mongolia and the State of Palestine.
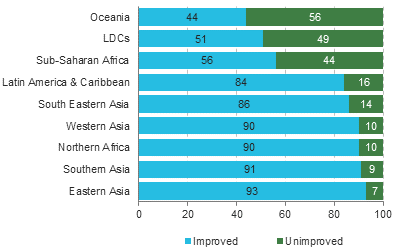
While the challenges of providing safe water in cities have almost been addressed, the problem of access to improved drinking water sourcesOne that, by the nature of its construction and when properly used, adequately protects the source from outside contamination, particularly faecal matter.
more remains an issue for many rural areas around the world. This is particularly evident for Oceania and sub-Saharan Africa (figure 6.3).
Similarly to drinking water, there have been very significant improvements with regard to the availability of improved sanitation facilitiesAccess to sanitation facilities refers to the percentage of the population with at least adequate access to excreta-disposal facilities that can effectively prevent human, animal and insect contact with excreta.
more around the world.
However, data availability for this basic service remains quite poor, in particular at country level. In 1990, only one in two people had access to good quality sanitation compared with almost 70 per cent of the world’s population today. Since then some 2.1 billion people worldwide have gained access to improved sanitation.
But progress has been uneven and today approximately 34 per cent of the world’s population are still using poor quality sanitation facilities, with almost 950 million people still practicing open defecation (United Nations, 2015).
From an absolute perspective, the improvements may appear modest, as today 2.4 billion people still do not have access to sanitation facilities compared with 2.5 billion in 1990.
The growth in the global population, primarily in developing regions, has contributed to this apparent discrepancy between proportion and absolute populations.

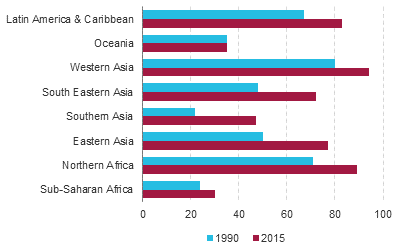
Regionally, improvements have differed radically in scale (figure 6.4). While Southern Asia has enjoyed dramatic improvements in sanitation over the past 25 years, there have been no overall improvements in Oceania. Particularly, Papua New Guinea has bucked the global trend, experiencing some deterioration in sanitation facilities since 1990. Despite improvements, sub-Saharan Africa still suffers from very poor sanitation services, with more than two thirds of the population without access to proper facilities. In many countries - Benin, Burkina Faso, the Central African Republic, the Congo, Côte d’Ivoire, Eritrea, Ghana, Guinea, Guinea-Bissau, Mozambique, Uganda and the United Republic of Tanzania - as many as four out of five people do not have access to them. In Chad, the Niger, Sierra Leone and Togo, only 1 in 10 people enjoy proper facilities. Data for individual countries are available on the Joint Monitoring Programme website.
Even though for least developed countries (LDCs)The category of Least Developed Countries (LDCs) was officially established in 1971 by the UN General Assembly with a view to attracting special international support for the most vulnerable and disadvantaged members of the UN family.
more as a whole, the improvement has been dramatic, almost two thirds of their respective populations still remain without good quality sanitation. Like drinking water, there is a marked difference in the availability of proper sanitation facilities between rural and urban populations around the world.
From the data available, it is clear that the situation is worse in rural areas where roughly 1.7 billion people (half of the global rural population) live without sanitation (figure 6.5). Over the past 25 years, sanitation has only improved for half of rural populations globally.
But for least developed countries (LDCs)The category of Least Developed Countries (LDCs) was officially established in 1971 by the UN General Assembly with a view to attracting special international support for the most vulnerable and disadvantaged members of the UN family.
more, the situation has only improved for a third of the population. In urban areas the problem is less acute but nevertheless remains a serious problem, with some 705 million people living in unsanitary conditions. This nevertheless represents a sizeable improvement compared with two or three decades ago.
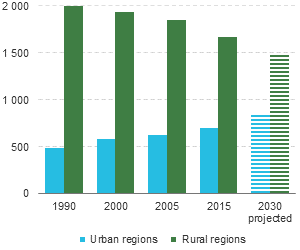
The population of the world is projected to grow by some 2.3 billion people over the next 30 years (see special note on population). This will also contribute to maintaining the absolute number of people living without improved sanitation facilitiesAccess to sanitation facilities refers to the percentage of the population with at least adequate access to excreta-disposal facilities that can effectively prevent human, animal and insect contact with excreta.
more at a high level. In particular, as urban populations are expected to grow more quickly than rural populations, the gap between the two "unserved" populations is expected to narrow as lack of sanitation in urban areas becomes a growing problem.