


Goal 17
Partnerships for the goals
The indicator that the Inter-agency Expert Group on Sustainable Development Goal Indicators (IAEG-SDG) selected is Developing countries’ and least developed countries’ share of global exports
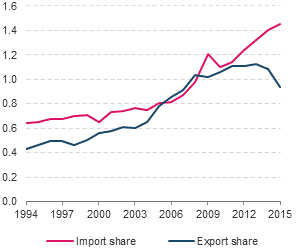
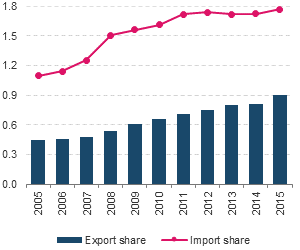
. Figure 17.23 and 17.24 present the changes in the share of exports and imports in merchandise and services for least developed countries (LDCs) since 1994 for merchandise and 2005 for services. The statistics presented for services exports are based on the definitions of servicesServices are the result of a production activity that changes the conditions of the consuming units or facilitates the exchange of products or financial assets.
more as prescribed in the sixth edition of the International Monetary Fund (IMF) Balance of Payments and International Investment Position Manual (IMF, 2009), the data of which are available only from 2005.
In 2015, the value of merchandise exports from LDCs was US$154 billion. The LDC share of world exports almost doubled over 15 years, from 0.6 per cent in 2000 to 1 per cent in 2015 (see figure 17.23). The LDC share of world merchandise imports increased even more, from 0.7 per cent in 2000 to 1.5 per cent in 2015, to reach an estimated US$241 billion. The key driver of export growth over this period was the massive rise in the price of fuels, ores and metals, reflecting the high demand in developing countries, most notably China.
For services trade, in 2015 the LDC share of world services exports (US$4.7 trillion) was 0.9 per cent (US$42 billion), showing a significant increase from 0.5 per cent (US$12 billion) in 2005. As for services imports, the share in 2015 was 1.8 per cent (US$82 billion), up from 1.1 per cent (US$28 billion) in 2005 (see figure 17.24).
UNCTAD investigates whether an improvement in market access conditions in terms of tariff preferences would be enough to double the export shares of LDCs (UNCTAD, 2016b). As noted in Goal 17 target 10, applied tariffs have been reduced, if not eliminated, in various settings, including via bilateral or regional free trade agreementsThese are treaties between two or more countries that establish free trade agreements under which commerce in goods and services can be conducted across the countries’ common borders, without tariffs or hindrances but capital or labour may not move freely.
more. In April 2015, the number of regional trade agreements (RTA) notified to WTO was 612, of which 406 are currently in force. The number of RTAs in force in 1994 was approximately 100. Few RTAs involve LDCs. In this context, even if LDCs receive duty-free and quota-free market access treatment, the value of the relative preferential marginAn RPM is the difference between the preferential rate for LDCs and the applied tariff rates applicable to LDC competitor countries in the same market taking into account the preferential tariff rates that are applicable to them.
more (RPM) also falls. Nicita and Rollo estimate that one unit fall in the preferential margin (in RPMs) reduces the exports of preference-receiving countries by on average 0.3 percentage points and that the proliferation of RTAs outside sub-Saharan Africa could limit new export opportunities via a reduction in RPMs (Nicita and Rollo, 2013). As tariff rates have fallen globally in the past decades, market access conditions for LDCs have been increasingly determined by non-tariff measuresNon-tariffs measures may include any policy measures other than tariffs that can impact trade flows.
more such as sanitary and phytosanitary measures and technical barriers to trade. UNCTAD estimates that more than 50 per cent of the exported products of developing countries face some type of non-tariff measure, the majority of which are sanitary and phytosanitary measures and technical barriers to trade (UNCTAD, 2013c). Non-tariff measures for key LDC exports, such as textiles and clothing, and footwear and agricultural products, are substantial, ranging at around 10-27 per cent of the tariff equivalent. Trade costs arising from non-tariff measures on exports are disproportionately larger for LDCs than for high income countries (Nicita and Murina, 2014).
An additional question regarding market access of LDC exports concerns their physical connectivity to international markets. Reducing tariffs or non-tariff measures faced by LDC exports will do little to increase their price competitiveness if LDCs cannot bring their goods to market at a reasonable cost. This point is well illustrated, for example, by the Liner Shipping Connectivity Matrix, many LDCs are at the bottom of rankings of direct maritime connectivity measured by the average number of trans-shipments. (For more information see UNCTAD Review of Maritime Transport series.) The absence of a direct connection may be associated with export losses of 42-55 per cent (Fugazza, 2015).