Goal 2
Zero hunger

The ambition of ensuring access to safe, nutritious and sufficient food is in large measure an extension of target 1.C of the Millennium Development Goals, which sets out to halve, between 1990 and 2015, the proportion of people who suffer from hunger
. This has almost been achieved, with the proportion of undernourished people in the developing regions having fallen by almost half since 1990. But today almost 800 million people are still estimated to be undernourished and more than 90 million children under the age of five are still undernourished and underweight (United Nations, 2015).
The Inter-agency and Expert Group on Sustainable Development Goal Indicators (IAEG-SDG) recommends the prevalence of undernourishment
2.9 as one of two appropriate indicators to measure progress towards this target2.10.

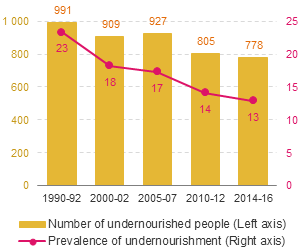
From a global perspective, the prevalence rate has fallen from 18.6 per cent in the early 1990s to 10.8 per cent today. For developing countries the improvement has been more dramatic, falling from 23.3 to 12.9 per cent during the same period (figure 2.3).
However, the global population has continued to rise and consequently the absolute number of people still suffering from undernourishment has fallen at a more modest rate, from just over 1 billion in the early 1990s to slightly less than 800 million people today (see special note on population).
Not surprisingly, the changes in global prevalence rates of undernourishment and the numbers enduring undernourishment are driven by changes in developing countries, as roughly 98 per cent of all undernourished people live in these countries (UNCTAD calculations based on FAOSTAT data).
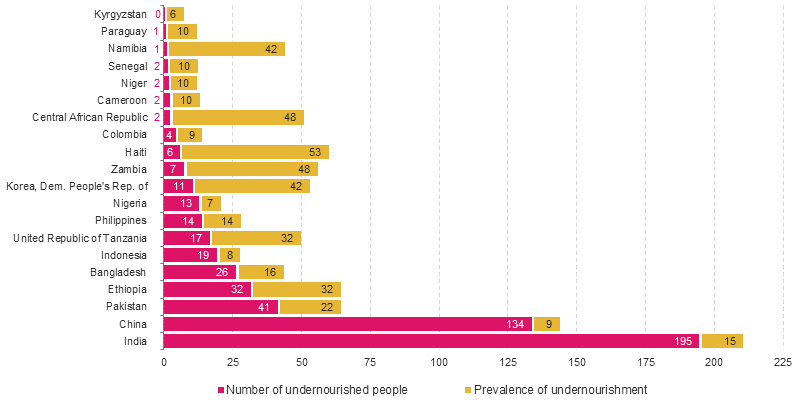
The global picture hides a wide variety of national experiences, however. In particular the impact of large countries is very evident. Figure 2.4 shows the prevalence rates of undernourishment and the numbers with undernourishment for a selection of developing countries, representing about 67 per cent of the global total. Although the prevalence rates for China and India are far from the highest, the absolute numbers affected in these countries are very large, combining to a total of approximately 330 million people and accounting for over 40 per cent of the global total.
In contrast, some of the countries with the highest prevalence rates (the Central African Republic, the Democratic People’s Republic of Korea, Haiti, Namibia and Zambia) have a relatively small impact on the global total.