


Goal 17
Partnerships for the goals

The ability of a State to mobilize its own resources and collect taxes to pay for essential services (education, health, social protection, security, and the like) is at the very heart of a properly functioning government. It is also essential for public investment in equitable and sustainable development and the reduction of dependence on aid. It has also been argued that domestic taxation also increases accountability and creates a platform for governments to engage with their citizens
thus creating a social or fiscal contract
between State and citizens (Organization for Economic Cooperation and Development (OECD), 2014a). The Monterrey Consensus (United Nations, 2003), the Doha Declaration on Financing for Development (United Nations, 2008) and most recently the Addis Ababa Action Agenda (United Nations, 2015) have all highlighted the important role of domestic financial resources for development and offsetting vulnerability. As John Di (2010) points out, taxation is a useful and often neglected indicator, not just on resource mobilization but also for measuring State performance. Examining several tax indicators contributes to identifying State authority and legitimacy and the likelihood of State resilience. The ability of sovereign States to raise taxes and implement independent tax policies can be undermined by financial globalization as individuals and corporations evade domestic taxation by moving assets. Movements of speculative capital also pose problems in this regard, heightening risks of capital flight. This problem may be more pronounced for developing countries (Helleiner, 1999; UNCTAD, 2015a).
Once you realize that trickle-down economics does not work, you will see the excessive tax cuts for the rich as what they are - a simple upward redistribution of income, rather than a way to make all of us richer, as we were told.
Chang H-J (2011)
Over the past decade, as developing countries have become wealthier, there has been a corresponding growth in domestic revenues available. Figure 17.1 shows the positive relationship between government revenues as a share of GDP and per capita GDP. Cross-country comparisons also show that OECD and other high-income countries tend to levy higher tax revenues as a percentage of GDP than developing or low/middle income countries. But within developing countries a wide variety of tax policies and regimes are employed, yielding a wide range of tax per GDP levels. For example, the Bahamas enjoy a relatively high per capita GDP17.12 but collect a proportionately low level of tax17.13.
Meanwhile the Plurinational State of Bolivia, Morocco, Trinidad and Tobago, and Turkey have very varied per capita GDP17.14 but all with tax revenues equating to about 28 per cent of GDP17.15. At the other extreme, Rwanda had a very low per capita GDP in 201217.16 but still generated the equivalent of 16 per cent of GDP through tax.
Within the high-income group of countries Canada, Ireland, New Zealand and the United Kingdom of Great Britain and Northern Ireland have quite high standards of per capita GDP but all have proportionately high tax revenues relative to the average17.17. Denmark collects the highest proportionate tax, 50.9 per cent in 2014, and interestingly is classified as the happiest country in the world (World Happiness Report) . One of the challenges with such cross-country analyses is that the results can vary dramatically depending on the data source used. The analysis above is based on calculations using OECD data and UNCTADstat. Had World Bank data been used, a different picture would have emerged (World Development Indicators).
In order to achieve the ambitious Sustainable Development Goal Agenda, developing countries will need to raise more revenues. While external sources will play their part, most of those revenues will be domestic. To balance increased revenues with equitable development, taxation will need to be progressive and used efficiently and transparently.
The Center for Strategic and International Studies (CSIS) estimates that during 2012 developing and emerging economies mobilized US$7.7 trillion in domestic resources (CSIS, 2014). Even in sub-Saharan Africa, where the pace of development has been slower, CSIS estimates that domestic resources exceeded US$530 billion. Yet the report African Economic Outlook (African Development Bank Group (ADBG et al., 2014) notes that in 2012 low-income African countries only mobilized an average 16.8 per cent of their GDP in tax revenues, below the minimum level of 20 per cent considered by the United Nations as necessary to achieve the Millennium Development Goals (United Nations Development Programme (UNDP, 2010)).
Lower- and middle-income African countries fell just short of the minimum target, with an average share of tax revenues in GDP of almost 20 per cent. Upper- and middle-income countries came closer to the OECD average of 35 per cent, at 34.4 per cent. For Africa as a whole, the tax burden stood at 26 per cent of GDP in 2012.
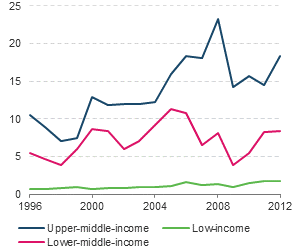
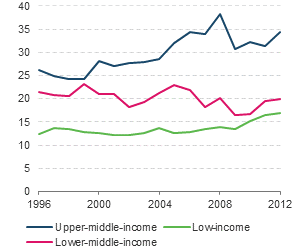
Figure 17.2 shows that the total tax take (as a percentage of GDP) has been growing slowly but fairly steadily for low-income African countries (from 12 per cent in 1996 to 17 per cent in 2012). For lower-middle-income countries the path has been more erratic and hasn’t led to any improvement but rather a worsening, from 21 per cent in 1996 to 20 per cent in 2012. For upper- and middle-income African countries the trend has also been quite volatile, but nevertheless an improving situation is evident with a tax burden in 2012 of 34 per cent (up from 26 per cent in 1996). While these improvements are welcome, some of the growth in domestic mobilization arose from the commodities boom or super-cycle, which now appears to have ended. These natural-resource-related tax revenues are reflected in other taxes
(figure 17.3).
In 2012, other taxes represented US$242 billion, amounting to 46 per cent of total tax revenue in Africa (ADBG et al., 2014). Such resource taxes and the rapid growth in private capital flows represent increasing vulnerabilities for developing and transition countries (UNCTAD, 2015a). Other taxes accounted for more than half of the total tax burden for African upper- and middle-income countries in 2012.