

ANNEXES
Special note on population

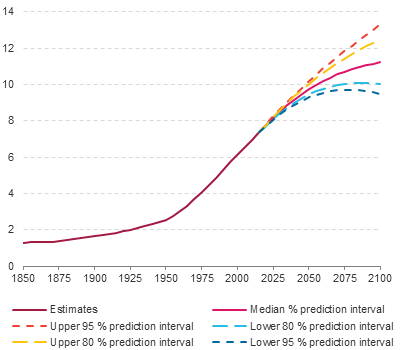
Over the next 85 years the population of the world is projected to increase by approximately 3.9 billion persons to reach 11.2 billion (United Nations Department of Economic and Social Affairs, 2015) (see figure 1). That is the equivalent of almost an additional 46 million people on the planet each year for the next 85 years, or 125,500 people every day. In population terms, it is the equivalent of another country the size of Kenya or Ukraine being added every year. These projections are based on fertility, mortality and migration patterns now, and on assumptions about what those patterns might look like in the future. As these assumptions project further into the future they become increasingly uncertain and hence the growing divergence between the upper and lower bounds. For the purposes of this note, the medium-variant projection will be used1.
These changes in population and demographic structure may impact on the health and well-being of millions of people in the years to come. In turn this will impact on the implementation of the Sustainable Development Goals, as populations in different regions contract and expand, and as gender and age profiles evolve. The purpose of this note is to outline some of the key population and demographic changes expected over the next 35 years to provide some context for Agenda 2030. Understanding these changes is important. Agenda 2030 will not be implemented during a static period, but rather one of quite dramatic population and demographic changes. Appreciating these changes helps in understanding the paradoxical situation where, despite significant reductions in the proportion of populations gaining access to basic services, such as clean water or sanitation facilities or those enduring extreme poverty, the absolute numbers can remain static or even increase. As the Agenda spans 15 years, the focus of this note is to examine the projected population patterns for the world and its principal geographic regions up to 2030, but the period beyond to 2050 is also considered.
Between 1850 and 1950, the population of the world increased from 1.3 billion to 2.5 billion people (United Nations Department of Economic and Social Affairs, 1999). Thereafter, the growth in population accelerated and today (2015) stands at approximately 7.3 billion. On its current trajectory, the world’s population is expected to reach 8.5 billion in 2030 and 9.7 billion in 2050.
The growth in population is not projected to be geographically evenly distributed, but rather it will be concentrated in developing countries in Africa and Asia. In fact, population growth in developing countries will account for the bulk (96 per cent) of this anticipated growth (table 1).

The population of Africa is projected to more than double between now and 2050, from 1.2 billion people to almost 2.5 billion2. The impact of this growth on Africa’s population share is quite dramatic, increasing from 16 per cent in 2015, to 20 per cent in 2030, 25 per cent in 2050 and 39 per cent in 2100.
Between now and 2050, the number of persons per square kilometre in Africa will increase from 40 to 84, and to 148 by the end of the century. Populations in Asia will grow by 20 per cent during the same period to reach 5.3 million people3. As a consequence, Asia’s share of the global population is projected to fall from 60 per cent today to 54 per cent in 2050.
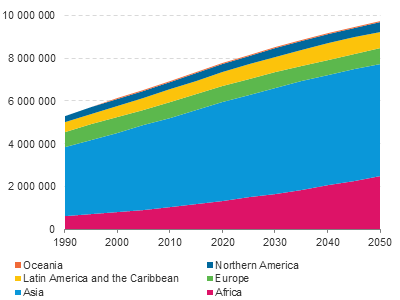
Population density is already very high in Asia, with 142 people for every square kilometre – this will increase to 170 by 2050. Of course, future projections for Asia have some added uncertainty owing to recent changes in the Chinese one-child
rule4, which until 2015 placed an artificial cap on fertility; it is not clear what the impact of this will be for future populations and gender balance5. The population of Europe is expected to decline, falling from 738 million to 707 million between now and 2050, and further to 646 million in 2100 (see table 1 and figure 2).
Asia will remain the single most populous region of the world. In 2015, five Asian developing economies – Bangladesh, China, India, Indonesia and Pakistan – were among some of the most populated economies of the world, with their combined populations accounting for 45 per cent of the global total6. The United Nations Department of Economic and Social Affairs (2015) anticipates that China’s population will peak around 2022 at around 1.4 billion, at which point it is expected to stabilize for a decade or so before beginning to decline slightly. India’s population is also expected to reach 1.4 billion around 2022, but will continue to grow to 1.5 billion in 2030 and 1.7 billion by 2050 to become the most populous country in the world (table 2).
The combined populations of China and India accounted for 37 per cent of the global population in 2015. This is projected to fall to 32 per cent by 2050. But as noted above, the likely trajectory of China’s population has additional uncertainty arising from the removal of the one-child policy in 2015.

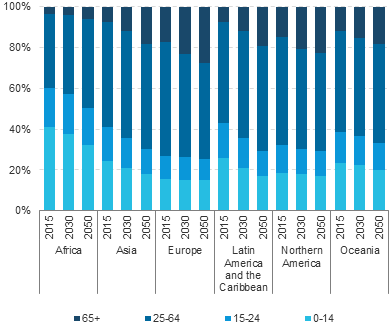
A new global distribution of population will not be the only outcome of uneven population growth; regional age profiles will also change as a consequence. There are already quite clear differences in the age profiles in the different regions around the world. In Africa today, 41 per cent of the population are children aged less than 15 and very few are aged over 65 (only 4 per cent).
In Europe, the age dividend has been spent – only 16 per cent of the population are aged less than 15 but 18 per cent are 65 years old or more. By 2050, the age profiles will have evolved so that in Asia, America and in particular Europe, the proportion of those aged 65 and more will have increased to 8, 15 and 28 per cent respectively.
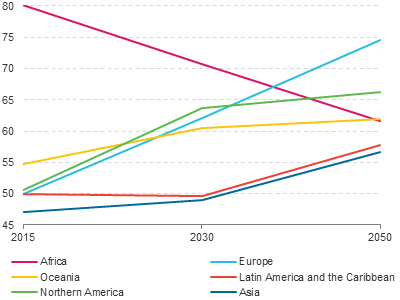
The consequent dependency ratiosDependency ratio (sometimes known as total dependency ratio or age dependency ratio) is defined as the ratio of the number of children (0–14 years old) and older persons (65 years or over) to the working-age population (15–64 years old).
more (see figure 4) show the ratio of net consumers (those aged 0–14 years old or 65 years or over) to net producers (the group most likely to be economically active are those aged between 15–64 years old) is expected to fall in Africa over the coming 35 years or so. In other words, the burden on the working population to support the non-working population is eased. This reduction in burden is sometimes referred to as the age dividend. By contrast, the dependency ratio in all the other regions is expected to increase. The most dramatic increases are expected in Europe, where the ratio will increase from 50 in 2016 to 75 in 2050. Such a high dependency ratio, particularly driven by a large population of older people, indicates that the economically active population and the economy as a whole will face a significant burden in providing the social services and health care required by older persons, who are often economically dependent. This raises questions regarding the sustainability of existing welfare and pensions models in Europe (Laqueur, 2011). It also has implications for economic growth and migration policy (European Union, 2015).

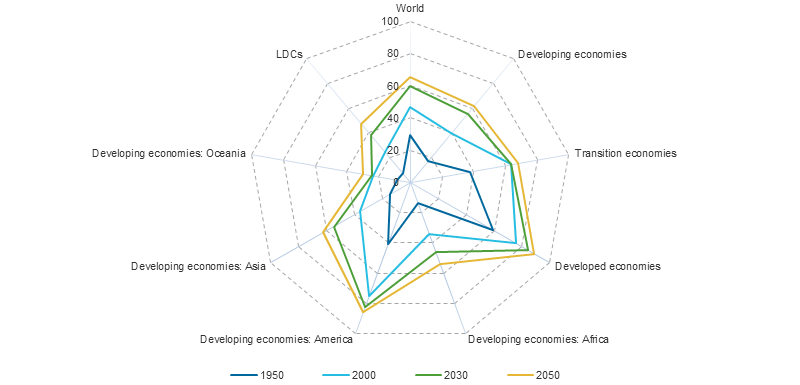
During the lifetime of Agenda 2030 and in the following two decades, the world will continue to urbanize. In 2016, 54 per cent of the population lives in urban centres. By 2030, this proportion will have increased to 60 per cent and to 66 per cent by 2050. Developed countries are already highly urbanized (81 per cent) and by 2050 that will have risen to 89 per cent. Developing economies, on average, are a good deal less urbanized but are also urbanizing rapidly (from the present 49 to 62 per cent projected for 2050). Urbanization rates in developing Latin America are comparable to the developed world average - 79 per cent. Developing Oceania and Africa are the least urbanized at 23 and 40 per cent respectively. By 2050, urbanization will have risen significantly in all developing regions: Africa 54 per cent, America 86 per cent, Asia 62 per cent and Oceania 30 per cent. Least developed countriesThis category was officially established in 1971 by the United Nations General Assembly with a view to attracting special international support for the most vulnerable and disadvantaged members of the United Nations family. Their low level of socioeconomic development is characterized by weak human and institutional capacities, low and unequally distributed income and scarcity of domestic financial resources.
more are currently predominantly rural, with only 31 per cent of populations living in urban centres, but by 2050 this proportion is projected to rise to 47 per cent (see figure 5).