Gross domestic product
Gross domestic product
| Gross domestic product per capita by region, 1992-2010 (Percentage and $) | |||||||
|---|---|---|---|---|---|---|---|
| Region | Real growth (%) | Nominal ($) | |||||
| 92-00 | 00 -10 | 2010 | |||||
| World | 1.7 | 1.6 | 9,178 | ||||
| Developing economies | 3.0 | 4.6 | 3,703 | ||||
| Africa | 0.7 | 2.7 | 1,676 | ||||
| America | 1.4 | 2.3 | 8,558 | ||||
| Asia | 4.3 | 5.9 | 3,508 | ||||
| Oceania | -0.4 | 0.7 | 3,313 | ||||
| LDCs | 1.8 | 4.8 | 737 | ||||
| Transition economies | -1.7 | 5.8 | 6,989 | ||||
| Developed economies | 2.3 | 1.0 | 39,445 | ||||
| Source: UNCTAD secretariat calculations, based on UNCTADstat | |||||||
The per capita level of gross domestic product Gross domestic product (GDP) is an aggregate measure of production equal to the sum of the gross value added of all resident institutional units engaged in production (plus any taxes, and minus any subsidies on products not included in the value of their outputs).
more(GDP) provides a rough summary indicator of the average living standard. Vast disparities in GDP per capita Gross domestic product (GDP) per capita is gross domestic product divided by population.
morelevels persist around the world. Average per capita incomes in developed countries exceed average per capita incomes in developing countries by a factor of nearly 11, and disparities are much starker still between the richest and poorest countries. While the income gap between developed and developing countries has declined in relative terms, it continues to widen in absolute terms, reaching $35,700 in current dollars in 2010 (Chart) Gap of gross domestic product per capita between developed and developing economies in absolute and relative terms, 1990-2010
(Ratio and $ per capita) 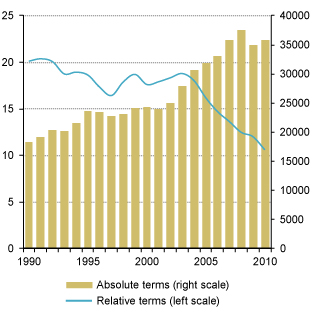 Source: UNCTAD secretariat calculations, based on UNCTADstat Note: Absolute terms calculated as differences between nominal GDP per capita of developed and developing economies .
Convergence of living standards around the world requires that per capita incomes grow faster in poor countries than in rich ones. A comparison of the evolution of growth trends of real GDP thus indicates whether the poor are catching up with the rich or not. The global boom of 2003–2007 generally reversed trends in place in the prior two decades that saw per capita incomes in the developing countries of Africa, the Americas, Western Asia and Oceania (and transition economies the second half of this period) grow at very low or even negative rates. In the last 20 years of the twentieth century only Eastern, Southern, and South-Eastern Asia had experienced catching up, and at a fast rate in their cases (Chart) Cumulative real gross domestic product per capita growth by region, 1971-2010
(Percentage) 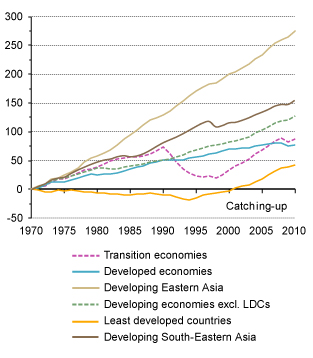 Source: UNCTAD secretariat calculations, based on UNCTADstat . Catching up has broadened since 2003 and may have accelerated further since the global crisis, albeit in a less benign way, since it is owing to a falling off in growth in developed countries that also risks holding back income growth in developing countries.
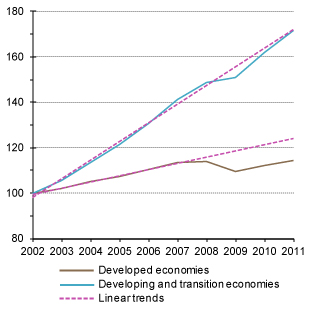
Real gross domestic product at market prices, 2002–2011
(Index numbers, 2002 = 100)
Source: UNCTAD secretariat calculations, based on UN/DESA, National Accounts Main Aggregates database and World Economic Situation and Prospects (WESP) 2011; ECLAC (2011); OECD (2011); and national sources.
At its peak, the global crisis severely affected economies around the globe. Its impact has proved more lasting in the case of key developed countries, however. Led by East Asia, developing countries at large have rebounded more vigorously from the global calamity. To begin with, not all developing countries had experienced the crisis as an absolute decline in income levels but as a slowdown in their rate of growth. Furthermore, only a small group of transition economies concentrated in Eastern Europe suffered grave declines in absolute income levels. These economies also seem to find it similarly hard to recoup lost ground, as do the developed countries that were at the heart of the global crisis. Meanwhile, developing countries at large have not only regained and exceeded pre-crisis GDP levels, but also returned to their pre-crisis growth path. This contrasts with the situation in developed countries. Barely regaining their pre-crisis income levels, as a group, developed countries continue to operate well below their pre-crisis growth trajectory. The situation is most critical today in those European countries that share the euro.
The crisis has not changed the fact that the bulk of global income, as expressed by world GDP, remains in the hands of the developed countries, but their share has shrunk sharply from 70 per cent in 1980 to 64 per cent in 2010 (Chart) Share of nominal gross domestic product by region in 1980 and 2010
((Percentage of world GDP) 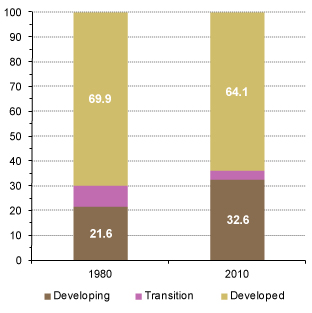 Source: UNCTAD secretariat calculations, based on UNCTADstat . The balance in the global economy is shifting fast (Table)
 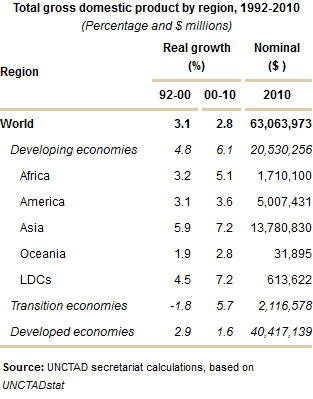 .
.
Highlights
- Catching up of developing countries has broadened since 2003 and accelerated recently;
- Large scope for catching up still exists as vast disparities in per capita income levels persist around the world;
- The global economy experienced high GDP growth rates in the mid-2000s but crisis left a lasting impact, with problems concentrated in key developed countries;
- The global crisis has accentuated the shifting balance in the world economy.
To learn more
UNCTAD Trade and Development Report 2011, Chapter I Current Trends and Issues in the World Economy, UNCTAD/TDR/2011
UNCTAD Trade and Development Report 2010, Chapter I After the Global Crisis: An Uneven and Fragile Recovery, UNCTAD/TDR/2010
UNCTAD Trade and Development Report 2009, Chapter I The Impact of the Global Crisis and the Short-term Policy Response, UNCTAD/TDR/2009
UNCTAD Trade and Development Report 2008, Chapter I Current Trends and Issues in the World Economy, UNCTAD/TDR/2008
UNCTAD Trade and Development Report 2007, Chapter I Current Issues in the World Economy, UNCTAD/TDR/2007
