Fiscal policy
Economic crises and fiscal accounts are closely interrelated, although the nature of that relationship is controversial. It is clear that fiscal balances Fiscal balance is the balance of a government's tax revenues, plus any proceeds from asset sales, minus government spending. If the balance is positive the government has a fiscal surplus, if negative a fiscal deficit.
deteriorated significantly in all regions with the crisis, but this correlation does not reveal causality. As several governments and international institutions are adopting fiscal austerity policies aimed at reducing their public-debt-to-GDP gross domestic productratios, it is important to examine whether such a policy tackles the roots of the problem.
Government revenues and expenditure and fiscal balance in developing East, South and South-East Asia,1997-2010
(Percentage of current GDP)
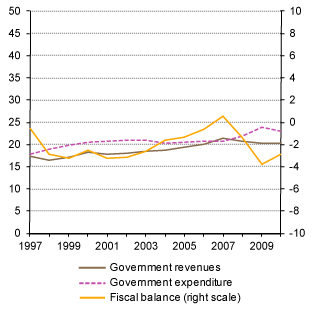
Source: UNCTAD, TDR 2011 (Chart 2.2), based on the European Commission, AMECO database; OECD, Economic Outlook database
Note: East, South and South-East Asia includes: China, China, Hong Kong SAR, Taiwan Province of China, India, Indonesia, the Islamic Republic of Iran, the Republic of Korea, Malaysia, Nepal, the Philippines, Singapore, Sri Lanka, Thailand and Viet Nam.
(Data for China refer to budget revenue and expenditure, they do not include extra-budgetary funds or social security funds.)
Many governments entered the crisis with fiscal surpluses or small deficits and with relatively low debt-to-GDP ratios. It was the fall in revenue caused by the crisis together with the increase in spending to reduce the impact of the crisis that deteriorated fiscal balances, in developing (Chart) Government revenues and expenditure and fiscal balance in developing Africa, 1997-2010
(Percentage of current GDP) 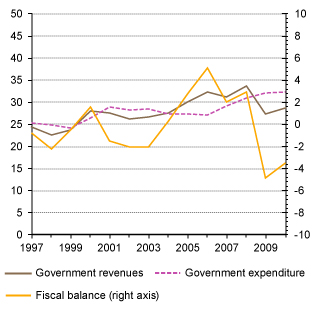 Source: UNCTAD, TDR 2011 (Chart 2.2), based on the European Commission, AMECO database; OECD, Economic Outlook database Note: Africa excludes:
Botswana, Burkina Faso, Cape Verde, Central African Republic, Equatorial Guinea, Lesotho, Liberia, Madagascar, Mauritania, Mayotte, Saint Helena, Seychelles, Somalia, Western Sahara, Zimbabwe. (Chart) Government revenues and expenditure and fiscal balance in developing Latin America and the Caribbean, 1997-2010
(Percentage of current GDP) 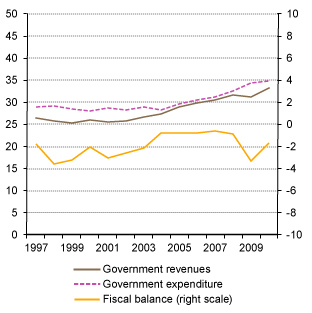 Source: UNCTAD, TDR 2011 (Chart 2.2), based on the European Commission, AMECO database; OECD, Economic Outlook database Note: Latin America and the Carribean comprises:
Argentina, Bolivia, Bolivarian Republic of Venezuela, Brazil, Chile, Colombia, Costa Rica, Ecuador, El Salvador, Mexico, Nicaragua, Peru, Uruguay. (Chart) Government revenues and expenditure and fiscal balance in developing West Asia, 1997-2010
(Percentage of current GDP) 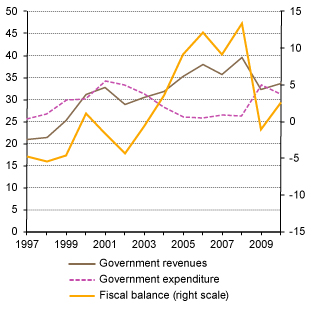 Source: UNCTAD, TDR 2011 (Chart 2.2), based on the European Commission, AMECO database; OECD, Economic Outlook database Note: West Asia excludes: Iraq, Occupied Palestinian territory and Yemen. , developed (Chart) Government revenues and expenditure and fiscal balance in developed economies, 1997-2010
(Percentage of current GDP) 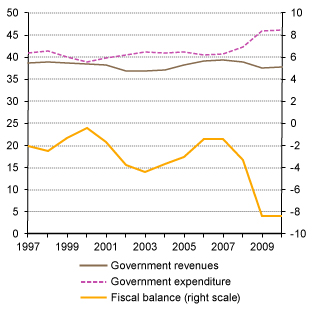 Source: UNCTAD, TDR 2011 (Chart 2.2), based on the European Commission, AMECO database; OECD, Economic Outlook database Note: Developed economies comprise: Austria, Belgium, Bulgaria, Canada, Cyprus, the Czech Republic, Denmark, Estonia, Finland, France, Germany, Greece, Iceland, Ireland, Italy, Japan, Latvia, Lithuania, Luxembourg, Malta, the Netherlands, Norway, Poland, Portugal, Romania, Slovakia, Spain, Sweden, Switzerland, the United Kingdom and the United States. and transition (Chart) Government revenues and expenditure and fiscal balance in transition economies, 1997-2010
(Percentage of current GDP) 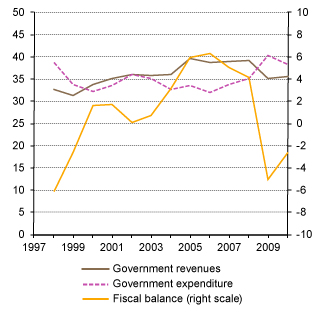 Source:UNCTAD, TDR 2011 (Chart 2.2), based on the European Commission, AMECO database; OECD, Economic Outlook database Note: Transition economies exclude Croatia and Montenegro, but include Mongolia. economies alike. However, economic recovery in developing countries and transition economies led to a significant improvement in fiscal accounts, while governments’ deficits remained high in developed countries. These trends are mirrored by the evolution of the public-debt-to-GDP ratios: Public debt Public debt are the external obligations of the government and public sector agencies.
ratios generally declined before the crisis, and it is only after 2008 that they increased considerably in high-income countries.
The fiscal responses to the crisis varied considerably across regions and countries, not only in terms of the size of their economic stimulus, but also in terms of its composition and timing. A detailed assessment of fiscal stimulus packages is not straightforward, because it is difficult to distinguish policy measures that were adopted in response to the crisis from others that were already planned or that would have been implemented in any case (e.g. public investments for reconstruction following natural disasters).
| Fiscal stimulus packages, as announced in selected developed economies, 2008-2010 ($ Billions and percentage) | ||||||||
|---|---|---|---|---|---|---|---|---|
| Total amount ($ billions) | GDP (%) | Tax cut share | Spending share | |||||
| Australia | 23 | 2.4 | 45.2 | 54.8 | ||||
| Canada | 24 | 1.8 | 52.4 | 47.6 | ||||
| France | 21 | 0.8 | 6.5 | 93.5 | ||||
| Germany | 47 | 1.4 | 68.0 | 32.0 | ||||
| Italy | 6 | 0.3 | 33.3 | 66.7 | ||||
| Japan | 117 | 2.3 | 30.0 | 70.0 | ||||
| Spain | 35 | 2.4 | 58.4 | 41.6 | ||||
| United Kingdom | 35 | 1.5 | 56.0 | 44.0 | ||||
| United States a | 821 | 5.7 | 36.5 | 63.5 | ||||
| Total | 1129 | 3.3 | 38.3 | 61.7 | ||||
| Unweighted average | 2.1 | 42.9 | 57.1 | |||||
| Source: UNCTAD, TDR 2011 (Table 2.2), based on European Commission, 2009; ECLAC, 2009; CBO, 2011; OECD, 2009; Hur et al., 2010; Ponomarenko and Vlasov, 2010; Prasad and Sorkin, 2009; and United States Government, 2011 | ||||||||
| Note: a The amount reported for the United States refers only to the stimulus package provided under the American Recovery and Reinvestment Act (ARRA) of 2009; it excludes the cost of industry bailouts and capital infusions that were components of the Troubled Asset Relief Program (TARP). | ||||||||
In addition, official announcements are not always made at the expected time, and they only provide a general idea of the size and composition of the packages. Among developed countries, the United States implemented the largest stimulus package, in both nominal terms and as a percentage of GDP. A relatively large share of the announced fiscal stimulus took the form of tax cuts (about 40 per cent) in developed countries, compared with only 5 per cent in the larger developing and transition economies (Table) 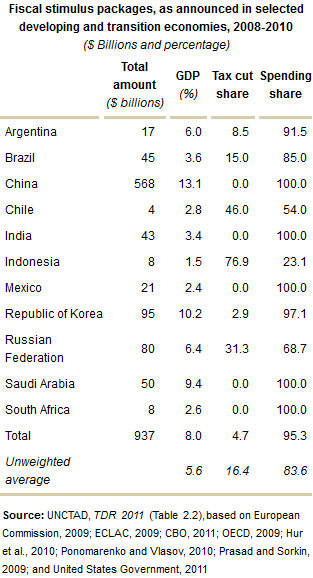 .
.
Governments of many natural-resource-rich countries, where public finances had a strongly pro-cyclical bias in the past, were generally able to adopt proactive countercyclical policies, despite the fall in commodity prices. During the commodity boom of the 2000s, several of these countries adopted fairly prudent fiscal policies, resulting in larger reserves. When the crisis erupted, they could increase their spending to moderate its impacts.
In many respects, the fiscal problems have been the result, not the cause, of the financial crisis. For that reason it would be more sensible to reduce debt-to-GDP ratios by boosting growth rather than cutting spending and increasing taxes to reduce debt, which might backfire and reduce growth. Excessive reliance on fiscal austerity might end up promoting an environment of low spending, reducing the chances of a private spending recovery, in particular in developed countries. Ultimately, it would not result in fiscal consolidation. The latter can only be achieved in highly indebted countries through a recovery of growth in the medium term, to which fiscal policy can contribute; in cases in which it would be difficult to increase total expenditure or reduce taxation, fiscal stimulus can be provided by changing the composition of spending and revenues. In particular, progressive income redistribution and public investment in infrastructure and alternative energy might be a suitable and simple way to boost demand, while creating the conditions for further growth.
Highlights
- Before the crisis most governments had fiscal surpluses or small deficits, and debt-to-GDP ratios were relatively low and in several cases declining;
- The fiscal problems have been the result, not the cause, of the financial crisis, which was fundamentally associated with the expansion and collapse of private debt, and consumption;
- Only in developed economies did public debt soar after the crisis;
- Fiscal responses to the crisis, in terms of the size and composition of the economic stimulus, varied considerably across regions and countries;
- Recovering growth is essential for curbing high public debt-to-GDP ratios; fiscal austerity may well be a self-defeating strategy.
To learn more
UNCTAD Trade and Development Report 2011, Chapter II Fiscal Aspects of the Financial Crisis and its Impact on Public Debt, UNCTAD/TDR/2011
UNCTAD Trade and Development Report 2011, Chapter III Fiscal Space, Debt Sustainability and Economic Growth, UNCTAD/TDR/2011
UNCTAD Trade and Development Report 2008, Chapter VI Current issues related to the external debt of developing countries, UNCTAD/TDR/2008
On the brink: fiscal austerity threatens a global recession, UNCTAD Policy Briefs, No. 24, 19/12/2011
