Migration and migrants' remittances
Migration and migrants' remittances
Share of international migrant stock in population by region, 1990-2010
(Percentage of population)
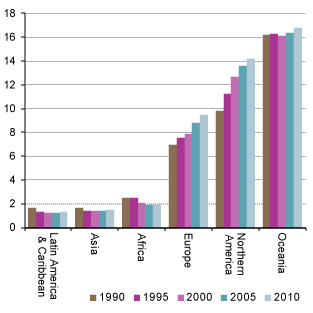
Source: UN DESA Population Division, Trends in International Migrant Stock: The 2008 Revision
Cross-border migration has been on the rise since the 1990s in many countries and regions. While traditional immigration countries of the past include the United States, Canada, Australia and New Zealand, some countries in Western Europe that had previously seen net emigration turned into immigration countries (Chart) Net immigration into developed economies, 1950-2010
(Net immigration as percentage of population) 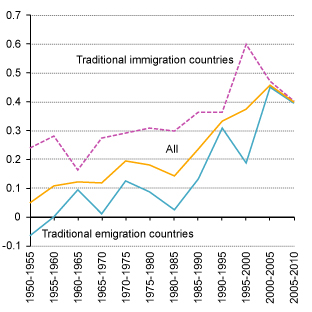 Source: UNCTAD secretariat calculations, based on UN Population Division, WPP: The 2010 Revision Note: Traditional immigration countries comprise Australia, Canada, New Zealand and the United States.
Traditional emigration countries are composed of 18 western European countries: Austria, Belgium, Denmark, Finland, France, Germany, Greece, Iceland, Ireland, Italy, Luxembourg, the Netherlands, Norway, Portugal, Spain, Sweden, Switzerland and United Kingdom. . The former Soviet Union and Eastern Europe have been a leading source region since the 1990s. Prominent South–South migration flows occur from South Asia to the Gulf region and in Southern Africa.
Compared with trade and financial integration, cross-border migration plays a lesser role in the globalization process, as immigration remains highly restricted in most countries. This contrasts with an earlier era of globalization from the mid-nineteenth century until the First World War, when world population grew only at about half the rate of the post-Second World War period (Chart) Global migration trends by destination, 1846-2010
(Five-years average, thousands) 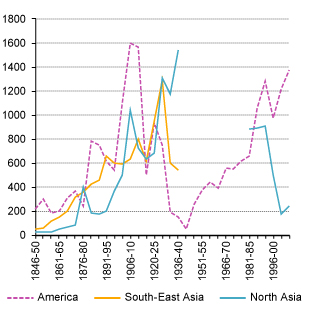 Source: UNCTAD secretariat calculations, based on McKeown, Adam, Global Migration, 1846-1940 and national sources Note: National sources:
For Australia: 1985 to 2010 data (fiscal years) are from the Department of Immigration and Citizenship;
1925 to 1985 data (calendar years) are from the Australian Bureau of Statistics
For Canada: Citizenship and Immigration Canada, Facts and Figures 2010-Immigration Overview
For United States: US Department of Homeland Security, Office of Immigration Statistics, Yearbook of Immigration Statistics 2010 .
In the OECD Organization for Economic Cooperation and Developmentarea as a whole, 19.4 per cent of immigrants have a tertiary level of education and the rate is higher for the foreign born than for the native born. This holds for most individual OECD countries. Similarly, the share of people with no or low educational attainment is higher for immigrants than for the native born (Chart) Level of education of immigrants in OECD countries
(Percentage) 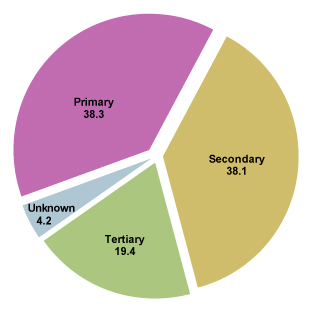 Source: OECD, Migration Statistics 2000 Census Note: Aged 15 and older; Level of education follows definition of UNESCO International Standard Classification of Education (ISCED). .
The impact of the global crisis on migration flows remains uncertain. In principle, despite its global reach, countries that were especially hard hit by the crisis may experience heightened pressures for emigration (push). However, sluggish recovery in developed countries that are traditionally prominent destinations of migration flows may fall behind in terms of their relative attractiveness or see the introduction of measures pertaining to the immigration of foreign workers in view of high unemployment (pull). Providing yet another indication of the ongoing shift in global balance, the European crisis has triggered sizeable migration flows from European crisis countries (Table) 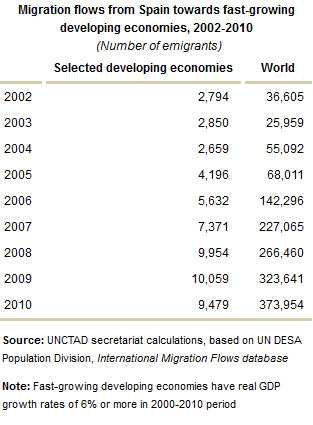 towards fast-growing developing economies.
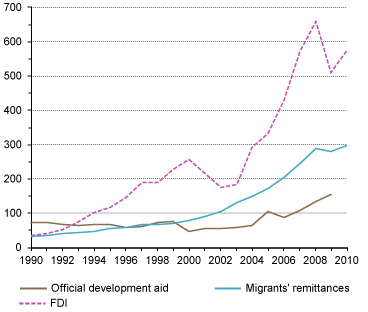
Migrant remittances and financial flows to developing economies, 1990-2010
($ billions)
Source: UNCTAD secretariat calculations, based on UNCTADstat
It is common for migrants A migrant is a person who comes to an economy and stays, or is expected to stay, for a year or more.
to retain links to their home countries, supporting family members left behind through cash- or in-kind transfers in particular (Table) 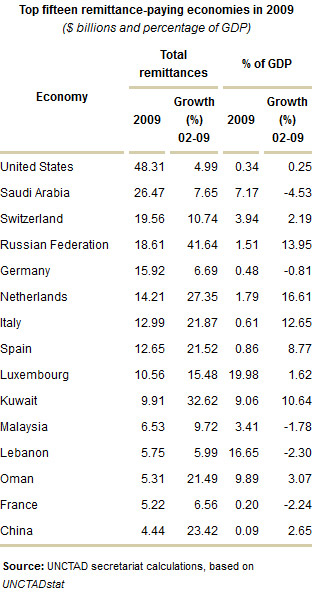 . Migrant remittances Migrant remittances cover current transfers by migrants: workers' remittances, compensation of employees and migrants' transfers.
to developing countries have seen a more than tenfold increase between 1990 and 2010, reaching $328 billion (Chart) Receipt of migrants' remittances by economic group, 1980-2010
($ billions) 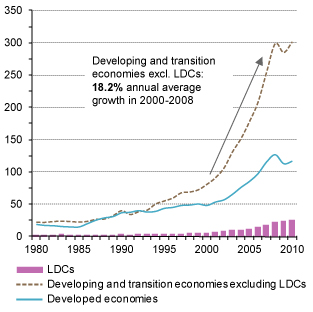 Source: UNCTAD secretariat calculations, based on UNCTADstat Note:
Total remittances cover workers' remittances, compensation of employees and migrants' transfers. . The staggering rise may be partly a reflection of improved tracking and recording of such flows. And it may partly reflect a shift from informal to formal channels induced by lower costs of remittance transfer. Even today, however, the proportion of remittances transferred through informal channels or not surpassing minimum thresholds for official recording likely remains large. In any case, migrant remittances have become an important source of foreign exchange earnings for many developing and transition economies. Already by 1996, remittances had eclipsed official development assistance (ODA) in that role, becoming the second-most important source of foreign exchange behind net FDI Foreign Direct Investmentflows, and a more stable one than the latter.
| Top fifteen remittance-receiving developing economies in 2010 ($ billions and percentage of GDP) | ||||||||
|---|---|---|---|---|---|---|---|---|
| Economy | Total remittances | % of GDP | ||||||
| 2010 | Growth (%) 00-10 | 2010 | Growth (%) 00-10 | |||||
| India | 55.00 | 5.32 | 3.39 | 0.79 | ||||
| China | 51.00 | 8.05 | 0.87 | 2.21 | ||||
| Mexico | 22.57 | 3.81 | 2.20 | 2.07 | ||||
| Philippines | 21.31 | 3.66 | 11.31 | 0.09 | ||||
| Bangladesh | 11.05 | 6.30 | 11.11 | 3.52 | ||||
| Nigeria | 9.97 | 9.39 | 4.49 | 3.16 | ||||
| Pakistan | 9.41 | 6.54 | 5.32 | 2.97 | ||||
| Lebanon | 8.18 | 5.02 | 21.07 | 2.23 | ||||
| Egypt | 7.68 | 4.37 | 3.58 | 1.34 | ||||
| Viet Nam | 7.22 | 4.96 | 7.27 | 0.54 | ||||
| Indonesia | 7.14 | 7.97 | 1.01 | 2.72 | ||||
| Morocco | 6.45 | 3.71 | 7.09 | 0.23 | ||||
| Brazil | 4.28 | 3.51 | 0.21 | -1.31 | ||||
| Guatemala | 4.26 | 6.84 | 10.36 | 3.63 | ||||
| Colombia | 3.94 | 3.14 | 1.40 | -1.11 | ||||
| Source: UNCTAD secretariat calculations, based on UNCTADstat | ||||||||
Migrant remittances are concentrated in a relatively small number of recipient countries: 10 countries account for half of total remittances, and the four largest recipients for more than a third; with India, China, Mexico and Philippines ranking top in terms of dollar volume of remittances. From a development perspective, it is more instructive to consider remittances relative to recipient countries’ income, for remittances have a relatively large weight in many smaller – and mainly low-income – economies. By 2010, the share of inward remittance flows in GDP gross domestic productin excess of 10 per cent included a group of 21 developing and transition economies. These countries are concentrated in Eastern Europe and CIS Commonwealth of Independent States and among island States in the Caribbean Sea, the Atlantic Ocean and Pacific Ocean.
Remittances may serve to support various developmental ends, ranging from poverty alleviation to the funding of small enterprises. Countries where remittances account for such a considerable share of GDP are particularly vulnerable to recession in the main immigration economies (i.e. countries in the European Union and the Gulf Cooperation Council, the Russian Federation and the United States). The global crisis had an immediate impact on migrant remittances. A 6 per cent decline was registered for 2009, following years of double-digit growth prior to 2008. Recovery started in 2010.
Highlights
- Cross-border migration has been on the rise in many countries and regions, though generally lagging other globalization trends;
- Migrant remittances to developing countries witnessed a near tenfold increase between 1990 and 2008;
- Remittances can be an important source of foreign exchange earnings;
- The global crisis impacted migrant remittances too; recovery is under way.
To learn more
Report of the Expert Meeting on Maximizing the Development Impact of Remittances, TD/B/C.I/EM.4/3
Impact of remittances on poverty in developing countries, UNCTAD/DITC/TNCD/2010/8
Maximizing the development impact of remittances, TD/B/C.I/EM.4/2
UNCTAD Trade and Development Report 2009, Chapter I The Impact of the Global Crisis and the Short Term Policy Responses: C. The ramification of the spreading crisis: Migrants' remittances, UNCTAD/TDR/2009
