Global trade trends
Global trade trends
Long-term trends in value and volume of merchandise exports, 1950-2010
(Index numbers, 2000=100)
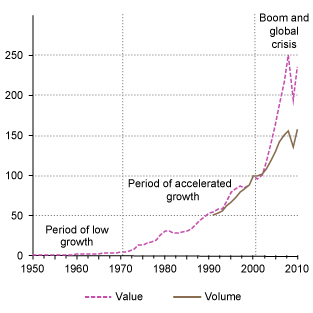
Source: UNCTAD secretariat calculations, based on UNCTADstat and CPB Netherlands Bureau of Economic Policy Analysis, World trade database
In the context of the global crisis international merchandise trade International merchandise trade includes goods which add or subtract from the stock of material resources of a country by entering (imports) or leaving (exports) its economic territory.
registered its greatest plunge since the Second World War: Between the fall of 2008 and the spring of 2009 global trade collapsed by 20 per cent in volumeReference to Volume disregards changes in prices and exchange rates. Volume movements are determined by holding the price constant.
. Having initially rebounded sharply beginning in mid 2009, growth in international merchandise trade then slowed again in the course of 2010. While regaining its pre-crisis peak level in that year, the global crisis appears to have left a marked impact on the dynamism of global trade, keeping the volume of global trade well below its pre-crisis growth trajectory (Chart) World merchandise exports volume,
January 2000-November 2011
(Index numbers, 2000=100) 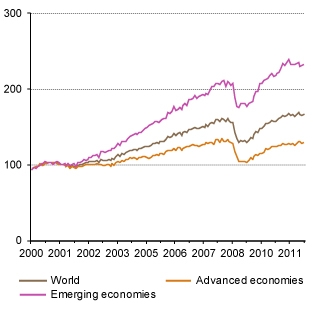 Source: UNCTAD secretariat calculations, based on CPB Netherlands Bureau of Economic Policy Analysis, World trade database Note:
Advanced economies consist of OECD countries excluding Turkey, Mexico, Republic of Korea and Central European countries. with global prospects dimming by year-end 2011.
Apart from remaining unfinished, the trade recovery has also been rather uneven. By the end of 2011, in developed countries as well as in South-East Europe and the Commonwealth of Independent States (CIS), where the trade collapse had been sharpest, merchandise trade in volume terms has yet to even reclaim its pre-crisis level. By contrast, the volume of both imports Imports of merchandise are goods that add to a country's stock of material resources by entering its statistical territory. It is recommended that merchandise imports be reported c.i.f. (cost, insurance and freight)
moreand exports Exports of merchandise are goods leaving the statistical territory of a country. It is recommended that merchandise exports be reported f.o.b. (free on board)
morein most groups of developing countries had already exceeded their pre-crisis peak in the course of 2010, with East Asia, China in particular, leading the expansion.
Globalization features the rise in global exports relative to global income, while individual countries see their respective exports and imports rise as shares of national income. In other words, a rising proportion of global production of goods and services is being traded across borders rather than sold at home. The global crisis has brought the long-run trend of rising global integration through trade to a halt, at least temporarily. The pre-crisis trend toward more openness and ever-deeper trade integration might well firmly reestablish itself in due course. But persistence or trend reversal seem also possible. At a time of high unemployment, fiscal austerity, and complaints of currency wars, the threat of rising trade protectionism is looming large.
The global crisis and uneven trade recovery have reinforced the ongoing shift in balance in the world economy, featuring the relative decline of developed countries (Chart) Share of developed economies in world trade,
1990-2010
(Percentage of world trade) 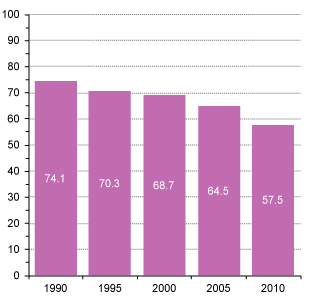 Source: UNCTAD secretariat calculations, based on UNCTADstat Note:
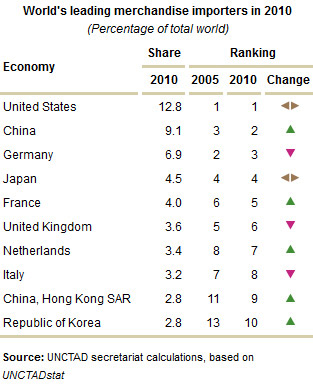
World trade is defined as the sum of exports and imports of merchandise and services. . In 2010 the value of total merchandise exports from all countries of the world was $15 trillion (in current United States dollars), of which the share of developed countries was 54 percent, down from 60 percent in 2005. As the world’s leading merchandise exporter since 2009, China’s share of world exports climbed to 10 per cent in 2010, ahead of the United States (8 per cent), Germany (8 per cent), and Japan (5 per cent) (Table) 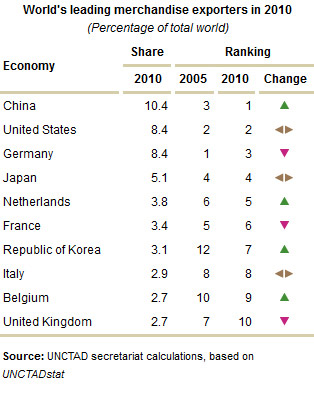 . On the import side, the ranking still shows the United States in first place (13 per cent), followed by China (9 per cent), Germany (7 per cent), and Japan (4.5 per cent) (Table)
  .
.
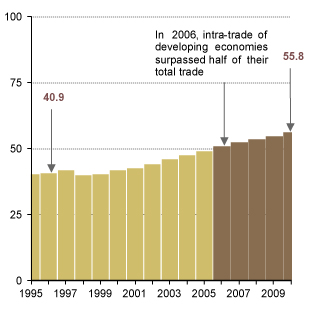
Share of South-South merchandise trade, 1995-2010
(Percentage of total trade in developing economies)
Source: UNCTAD secretariat calculations, based on UNCTADstat
Note: South-South trade is also known as intra-trade of developing economies.
The shifting global balance is also visible in the changing distribution of exports by destination, featuring the rising importance of trade among developing countries. The rise in South-South trade has been especially pronounced in East Asia and is linked to the gain in prominence of global supply chains.
While developing countries as a whole have become the key driving force behind global trade dynamics in the 2000s, and especially so since the recovery from the global trade collapse in 2008-2009, contributing 54 per cent to the overall rebound from it, performance varies considerably between regions and countries within the aggregate. Especially successful were developing economies in Asia. In general, progress in least developed countries (LDCs) and other low-income economies, after having fallen behind since the 1960s, has picked up somewhat, as they could recapture some of the lost ground since the mid-2000s. Helped by improvements in commodity prices, the export share of the LDCs, the majority of which are in sub-Saharan Africa and commodity-dependent, rose from 0.6 percent in 2001 to 1.1 percent in 2010 (Chart) Share of least developed countries in world merchandise exports, 1960-2010
(Percentage of world trade) 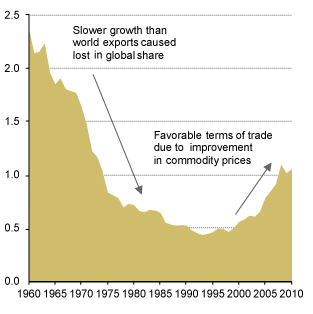 Source: UNCTAD secretariat calculations, based on UNCTADstat . Yet commodity price increases have been a mixed blessing even to LDCs, proving harmful rather than beneficial to some. Especially low-income, food-deficit countries that had suffered severely in the food crisis of 2007-2008 were again affected negatively in 2010-2011.
While an upward trend in world primary commodity prices asserted itself in the 2000s, reversing the prior downward trend that had been in place since 1995, the period surrounding the global crisis witnessed commodity prices taking a roller-coaster ride. The boom years since 2002 ended with a severe nosedive from their peak level of mid-2008, followed by a sharp rebound that took prices back to 2007 levels by early 2011 (Chart) Evolution of commodity price indices,
January 2000-December 2011
(Index numbers, 2000=100)  Source: UNCTAD, UNCTADstat Commodity Price Statistics Note:
- Non-fuel commodities consist of 1) Food and beverages,
2) Agricultural raw materials and 3) Mineral, ores and metals
- Crude petroleum is an average of UK Brent (light)/Dubai (medium)/Texas (heavy) equally weighted , when a sizeable correction began together with soaring volatility. Heightened market instability and price volatility (Table) 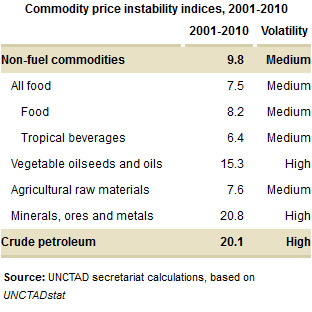 have become the norm as uncertainty about the global recovery is weighing on market participants’ minds.
Commodity price developments since 2002 came along with sizeable changes to terms of tradeTerms of trade or "net barter" terms of trade are defined as the ratio of the export unit value index to the import unit value index. Export and import unit value indices reflect changes in price levels...
more. In general, countries exporting oil and mining products saw substantial terms-of-trade gains, while those exporting mainly manufactures and importing raw materials, especially oil, experienced losses. Countries with more diversified exports and exporters of agriculture products experienced relative stability (Chart) Net barter terms of trade, 2000-2010
(Index numbers, 2000=100) 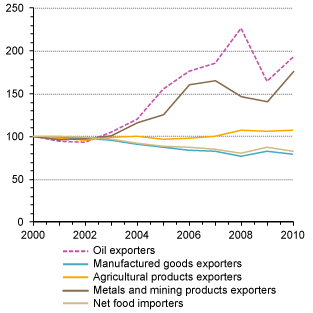 Source: UNCTAD, TDR 2011 (Chart 1.3), based on UNCTADstat Note:
Net food importers are low-income food-deficit countries, excluding exporters of fuels, metal and mining products. while manufactured goods exporters were confronted with a decline trend. Terms of trade changes can have substantial impacts on economies depending on their openness, in particular, either adding or subtracting from real domestic income. In the aggregate, all the developing regions gained, with the exception of East, South and South-East Asia (where manufactures constitute the largest share of exports). Wide differences exist within each region, however.
Highlights
- As trade flows have generally grown faster than income since the Second World War, countries’ openness and their exposure to external developments have increased;
- Global trade collapsed in the global crisis of 2008-2009, recovery remains unfinished and uneven; the global crisis appears to have left a marked impact on the dynamism of global trade;
- The global crisis has also brought the long-run trend of rising global integration through trade to a halt, at least temporarily;
- The global crisis and uneven trade recovery have reinforced the ongoing shift in balance in the world economy, featuring the relative decline of developed countries;
- The shifting global balance is also visible in the changing distribution of exports by destination, featuring the rising importance of trade among developing countries;
- The rise in South-South trade has been especially pronounced in East Asia;
- LDCs have generally participated in these trends to a lesser extent but recovered some lost ground in recent years;
- Related to commodity price developments; many countries have experienced sizeable terms-of-trade changes since 2002, with both winners (especially oil and metal exporters) and losers (especially food-deficit countries) among developing countries including LDCs;
- Global governance reform needs to make further progress.
To learn more
UNCTAD Trade and Development Report 2011, Chapter I Current Trends and Issues in the World Economy, UNCTAD/TDR/2011
UNCTAD Trade and Development Report 2007, Chapter III The "new regionalism" and North-South trade agreements, UNCTAD/TDR/2007
UNCTAD Trade and Development Report 2007 Chapter IV Regional cooperation and trade integration among developing countries, UNCTAD/TDR/2007
New and Traditional Trade Flows and the Economic Crisis, Policy Issues in International Trade and Commodities, Study Series No. 49 UNCTAD/ITCD/TAB/50, 11/12/2011
Evolution of the international trading system and of international trade from a development perspective, UNCTAD/TD/B/58/3, 04/07/2011
Integration of developing countries in global supply chains, including through adding value to their exports, UNCTAD/TD/B/C.I/16, 25/03/2011
